

Silver prices have had a brutal but attractive start to 2026. After soaring to an all-time high of around $121 on January 29th, it crashed nearly 47% by February 6th. But since then, silver has rebounded relentlessly by 32%, trading around $84 on February 20th.
With the market closed on the 21st and 22nd, the questions heading into March are clear. Is this recovery real, or is there more pain ahead? Technical and positioning data paint a mixed picture. Although consolidation is likely before the next decisive move, the weight of evidence is in the bullish direction.
Cup Formation, Hidden Bearish Divergence, and Signs of Consolidation
The daily chart of XAG/USD shows a developing cup pattern with an impulse wave that occurred on November 21, 2025, peaking at $121 on January 29, and returning to $63.85 on February 6. The recent rally towards $84 is now nearing the neckline of this formation.
From February 4th to February 20th, Silver is printing lower high settings. However, the Relative Strength Index (RSI), a momentum indicator, has made even higher highs over the same period, creating a hidden bearish RSI divergence.
This shows that despite the apparent strength of the RSI, the price trend prefers consolidation before a decisive move. This pattern holds true as long as the next candlestick is below $92 (the previous high) and the RSI continues to rise.
Smart Money Betting is also betting on consolidation.
Even if the current consolidation develops into a handle, it will need to sustain above $75 to sustain the bullish structure.
The cup-and-handle pattern gains validity with a clean day’s close above $84. However, some consolidation is initially expected, and the supporting indicators explain why a pause here is healthy rather than concerning.
Miners lead, silver futures lag: Physical vs. paper differences
Global X Silver Miners ETF (SIL) is trading above $107, adding early validation to the bullish case. SIL reached a high of $119 on January 26th. This was three days before spot silver hit its all-time high on January 29th. Miners leading the rally and maintaining a relatively solid recovery are classic bullish leading indicators.
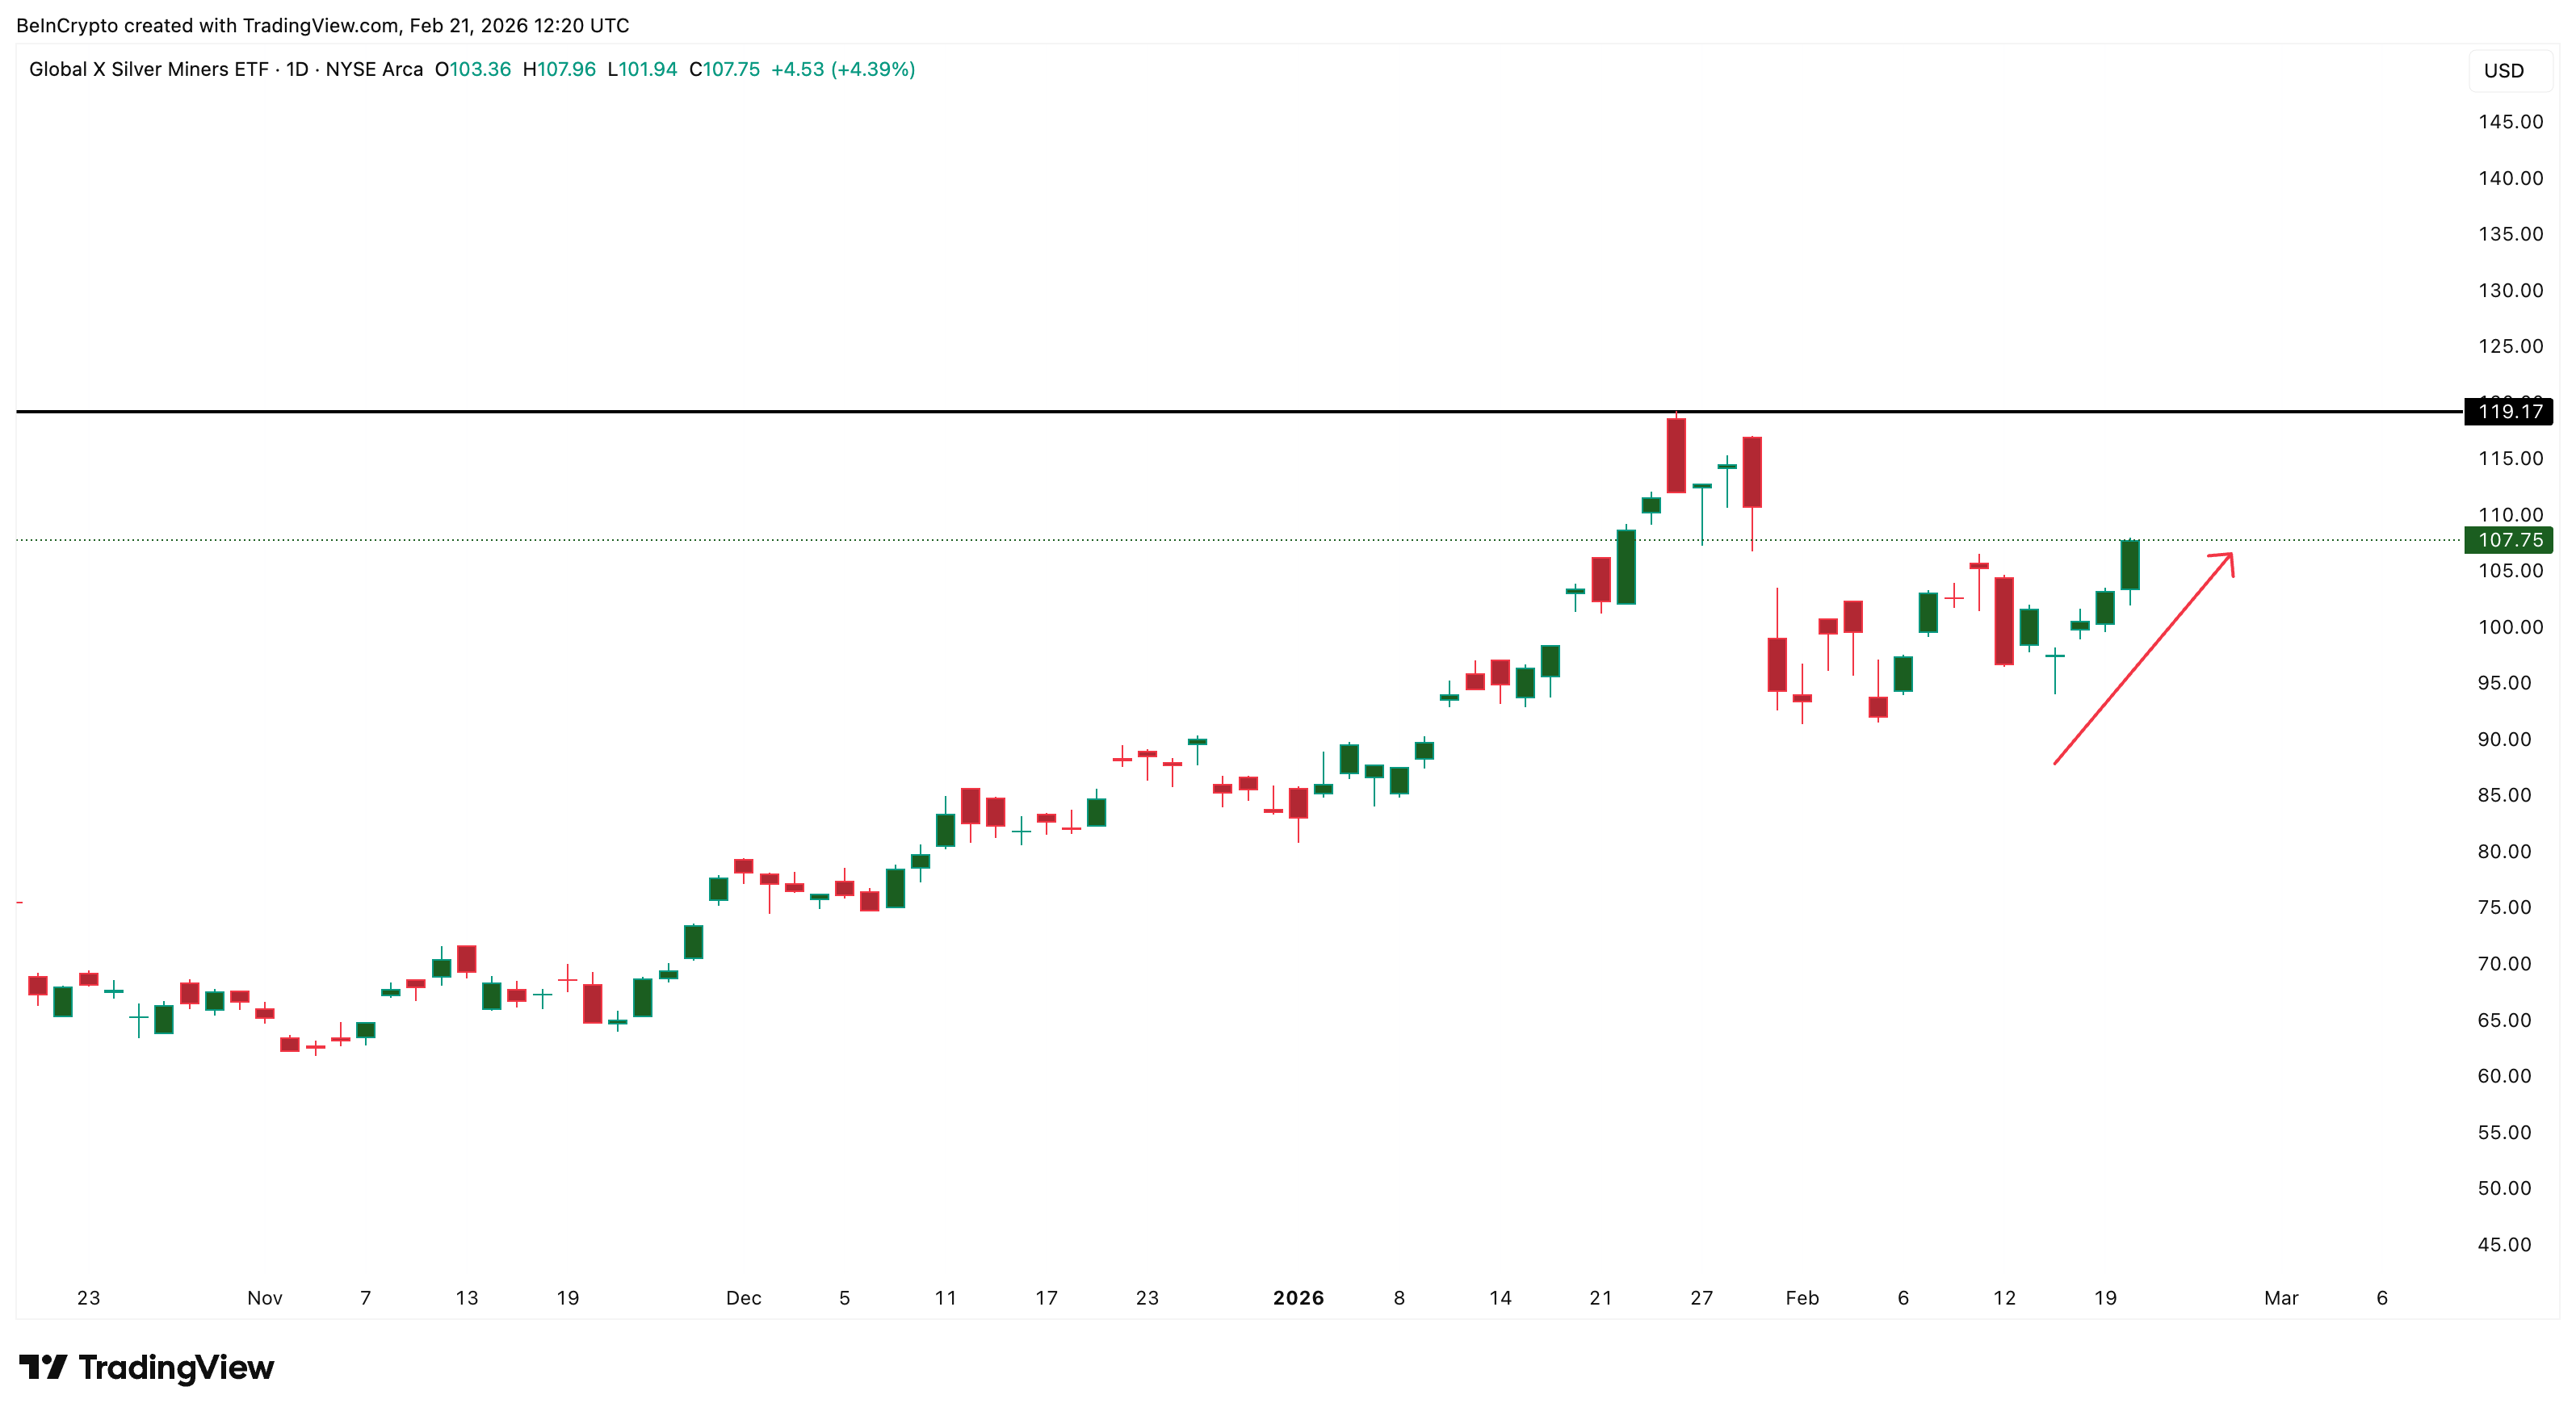
Mining companies have direct visibility into the industry’s order book and production demand, and their resilience suggests the fundamentals remain intact despite January’s liquidations. If a miner holds while the metal hardens, it usually indicates that the next move will be up rather than down.
This disconnect between strength in the physical market and hesitancy in the futures market is what defines the current situation with silver.
COMEX silver futures (SI1!) are trading around $82, below the spot price of $84. Such backwardation (futures below spot) is rare and significant. This means buyers are willing to pay a premium for physical silver now rather than waiting for delivery in the future.
The market is pricing in a sense of urgency, suggesting physical strain on the supply chain.
However, the open interest of SI1! It has been steadily declining since February 6, even as silver prices rose from $63 to $82. Rising prices amid falling open interest is a sign of rising short covering, with traders who were short after the crash buying back their positions and pushing up prices.
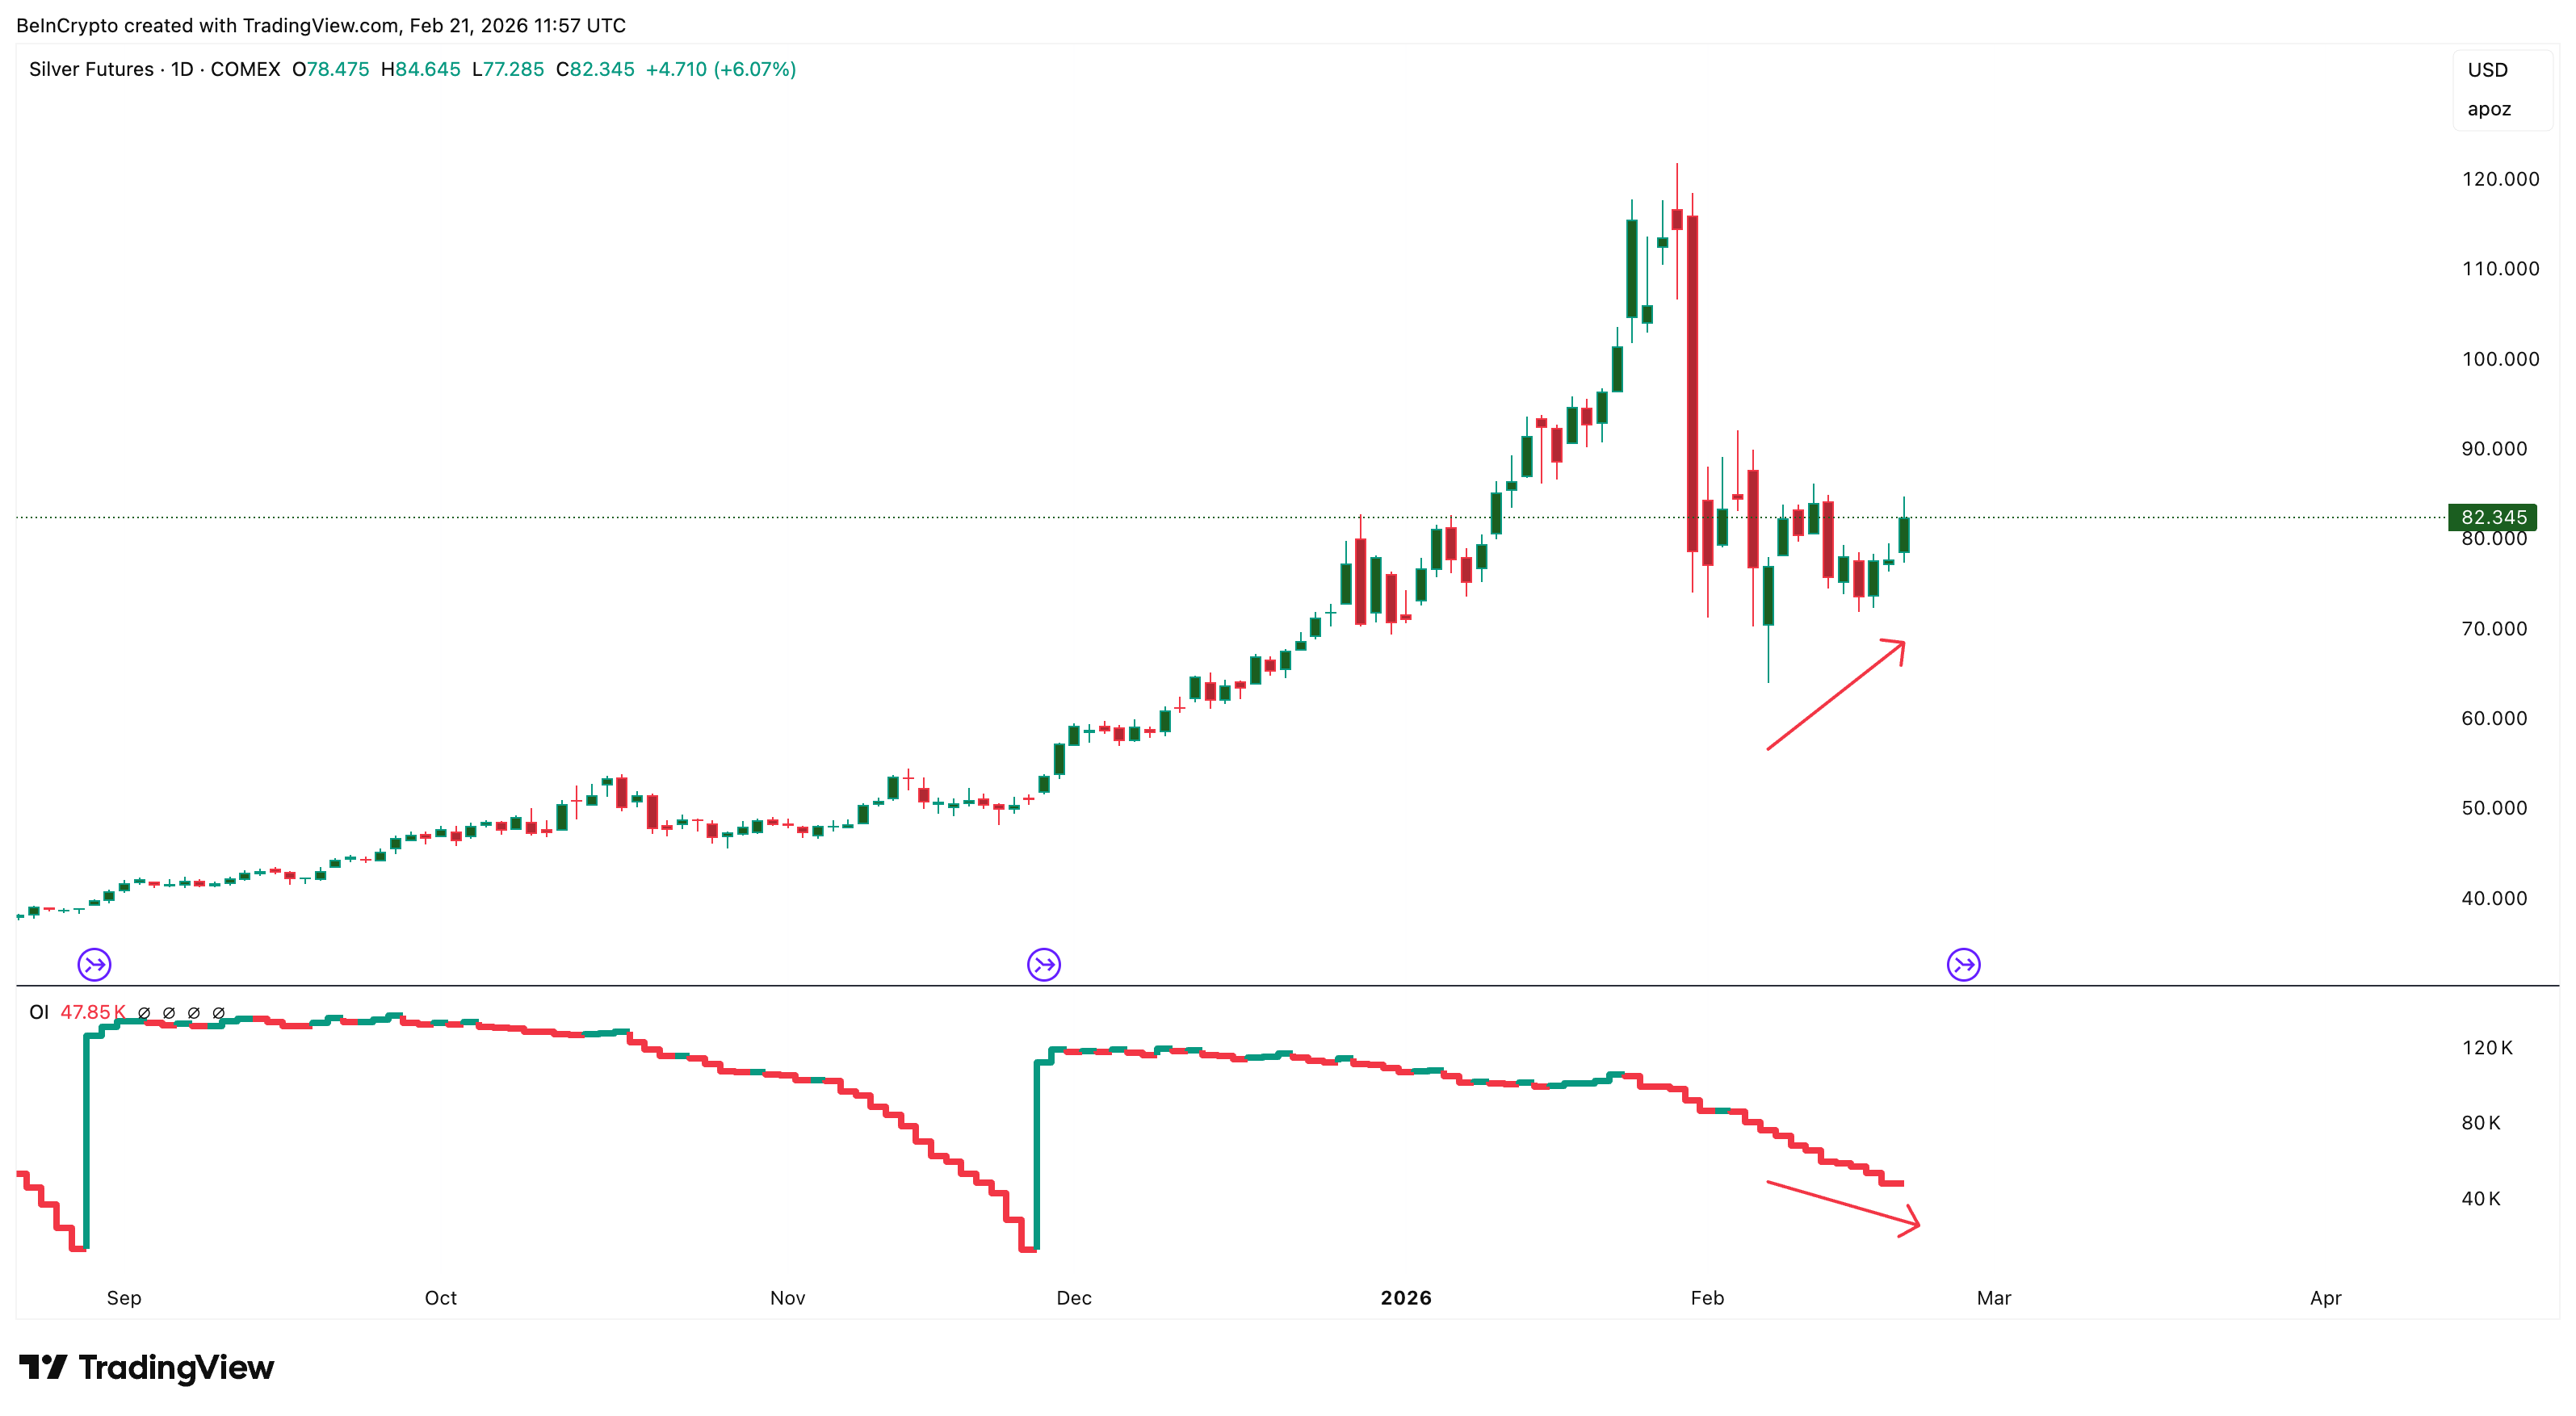
This does not mean that new funds have come in yet. It’s the aftermath of January’s wipeout sweep. Short-covering rallies have a natural ceiling, and once the cover is exhausted, new buyers are needed to maintain price momentum.
Here, a move towards integration is the most likely short-term path. Short-covering fuel is running low, but as we’ll see below, the next wave of buying has yet to arrive.
Dollar divergence, gold ratio risk, hedge funds on the sidelines
The macro and positioning layers explain why integration is healthy rather than dangerous.
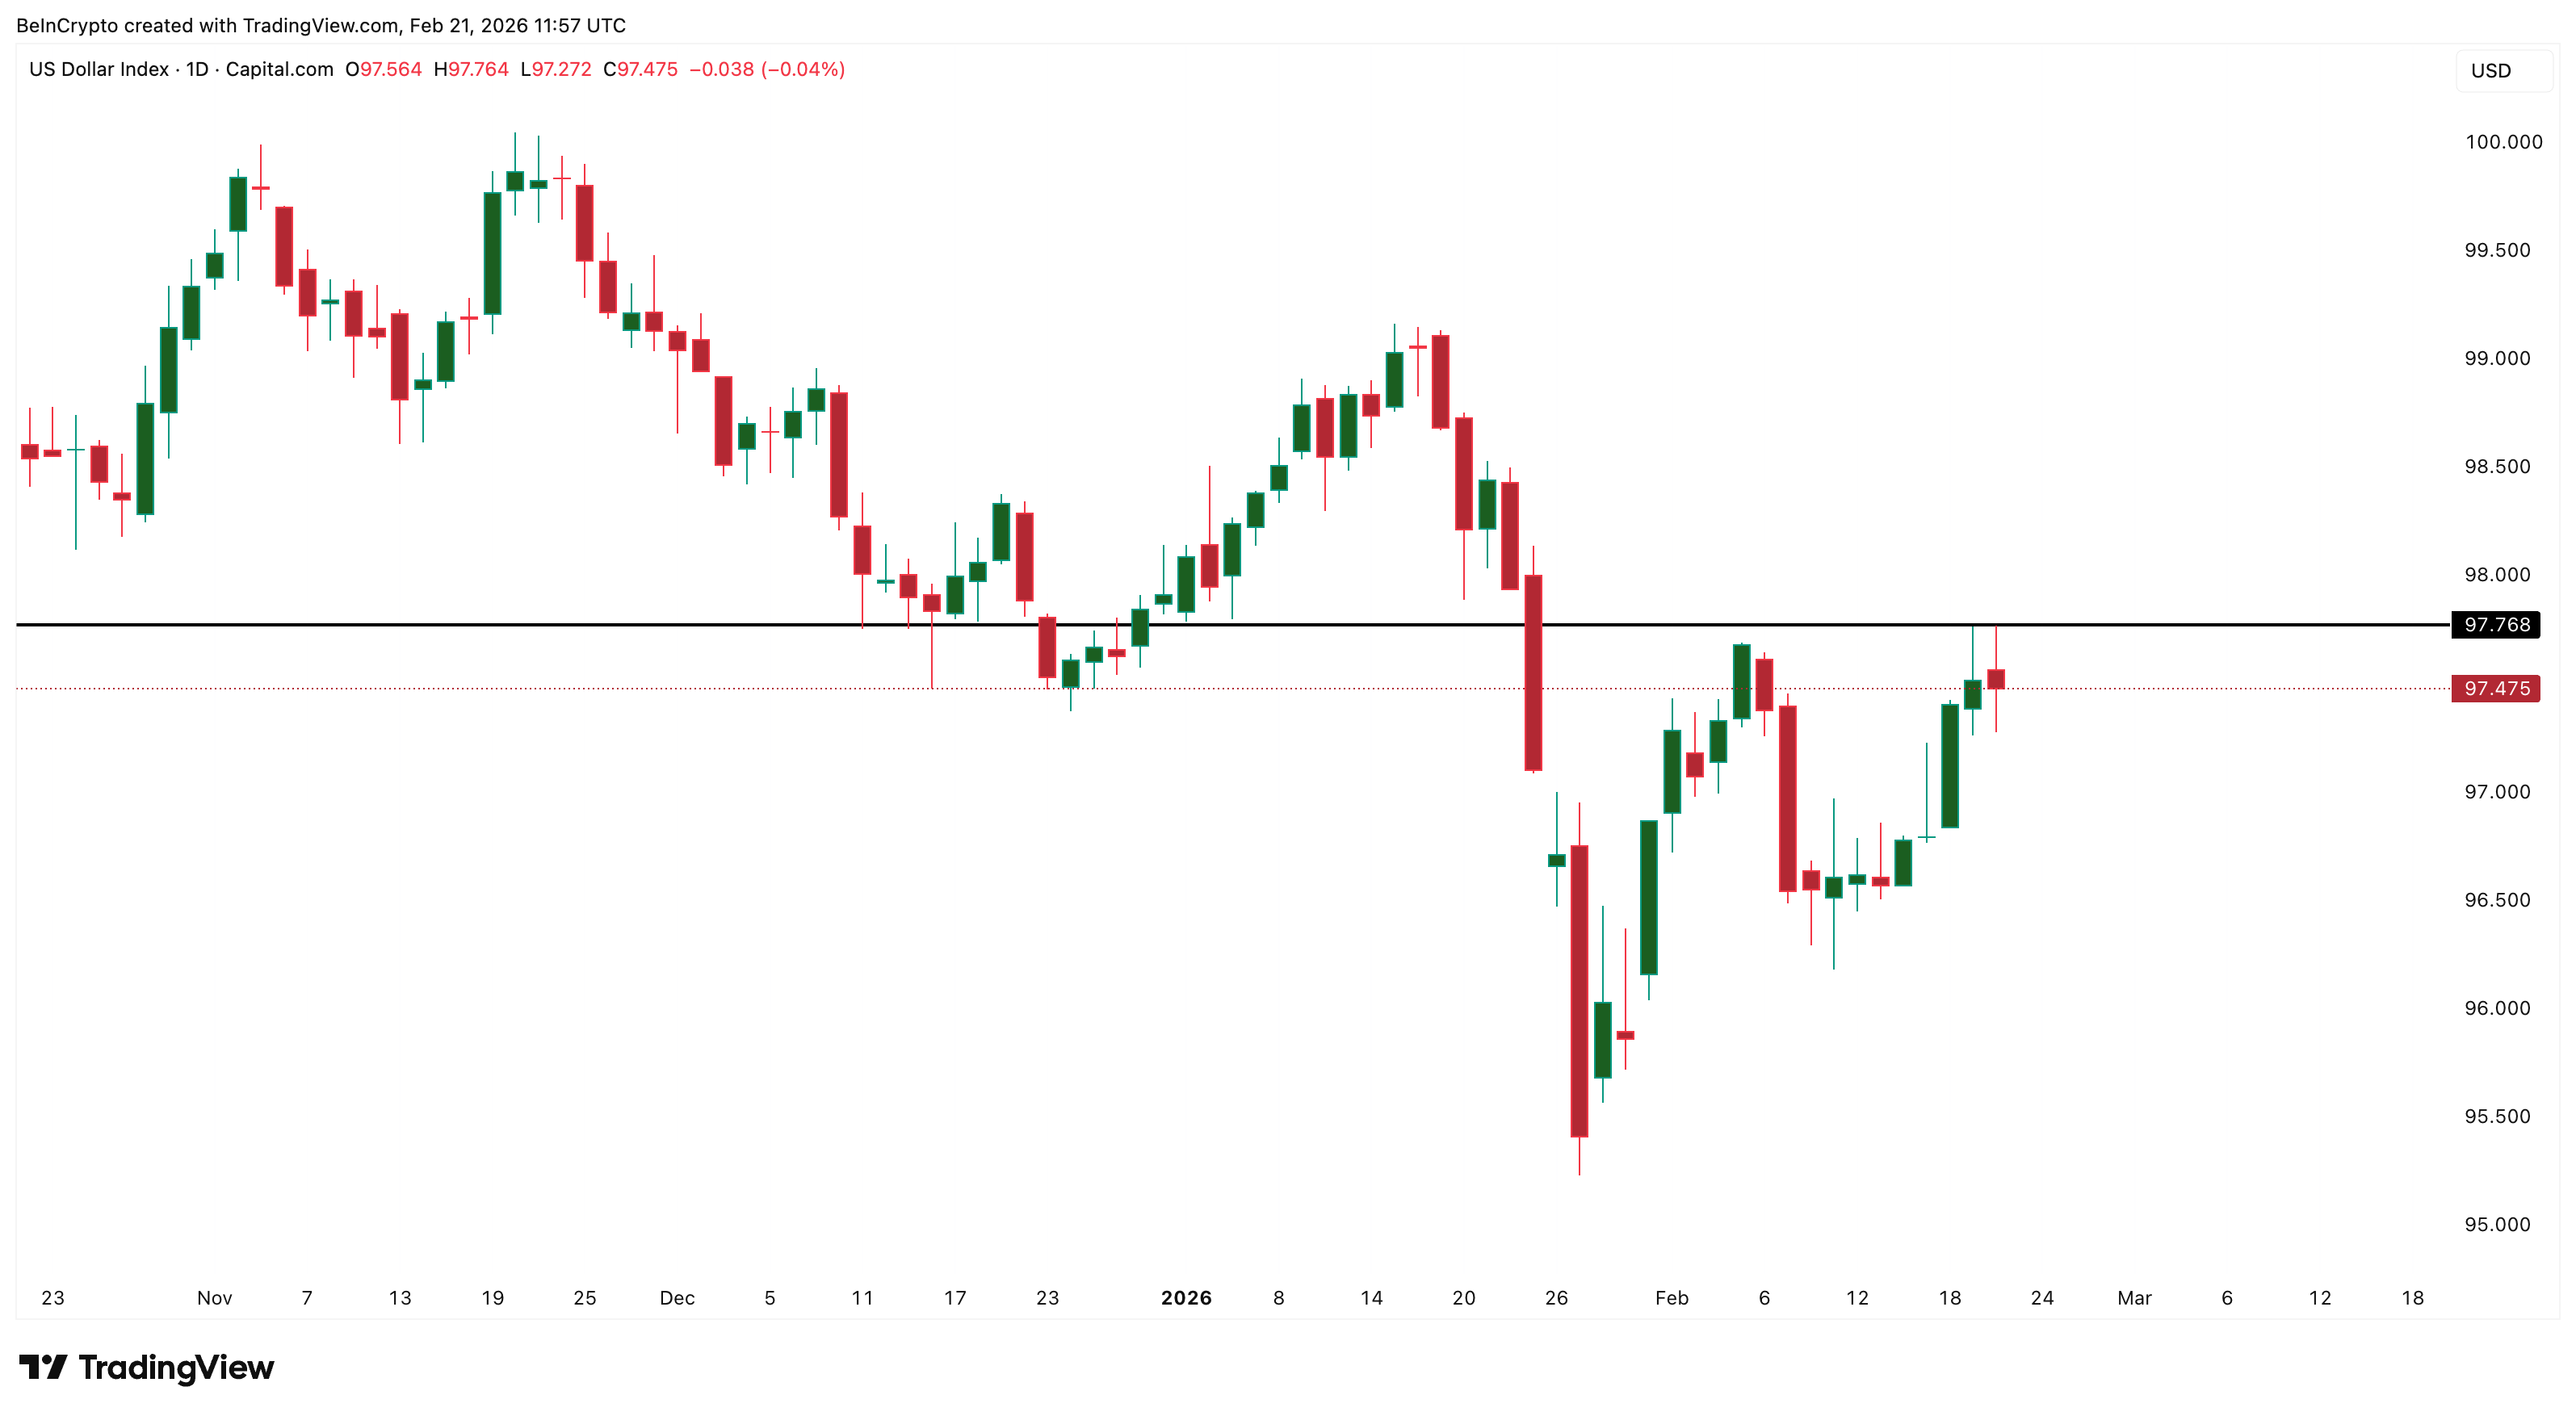
The US Dollar Index (DXY) is above 97 and has been steadily rising since February 11th. However, after February 17th, silver decoupled and began to rise along with the dollar. This is one of the strongest signals in my current setup. Silver rallying despite dollar headwinds means there is pent-up demand. Regardless of what the dollar does, buyers want silver now.
The gold-silver ratio (XAUXAG) is even more cautious. Currently at 60, this ratio has been falling since February 17, meaning silver has outperformed gold.
However, the ratio is consolidating within a bullish flag pattern. If it breaks out of the upper trend line, it could head towards 70 or above.
If that happens, gold will regain its dominance over silver. The market will flip from the risk-on appeal of silver to the safe purity of gold.
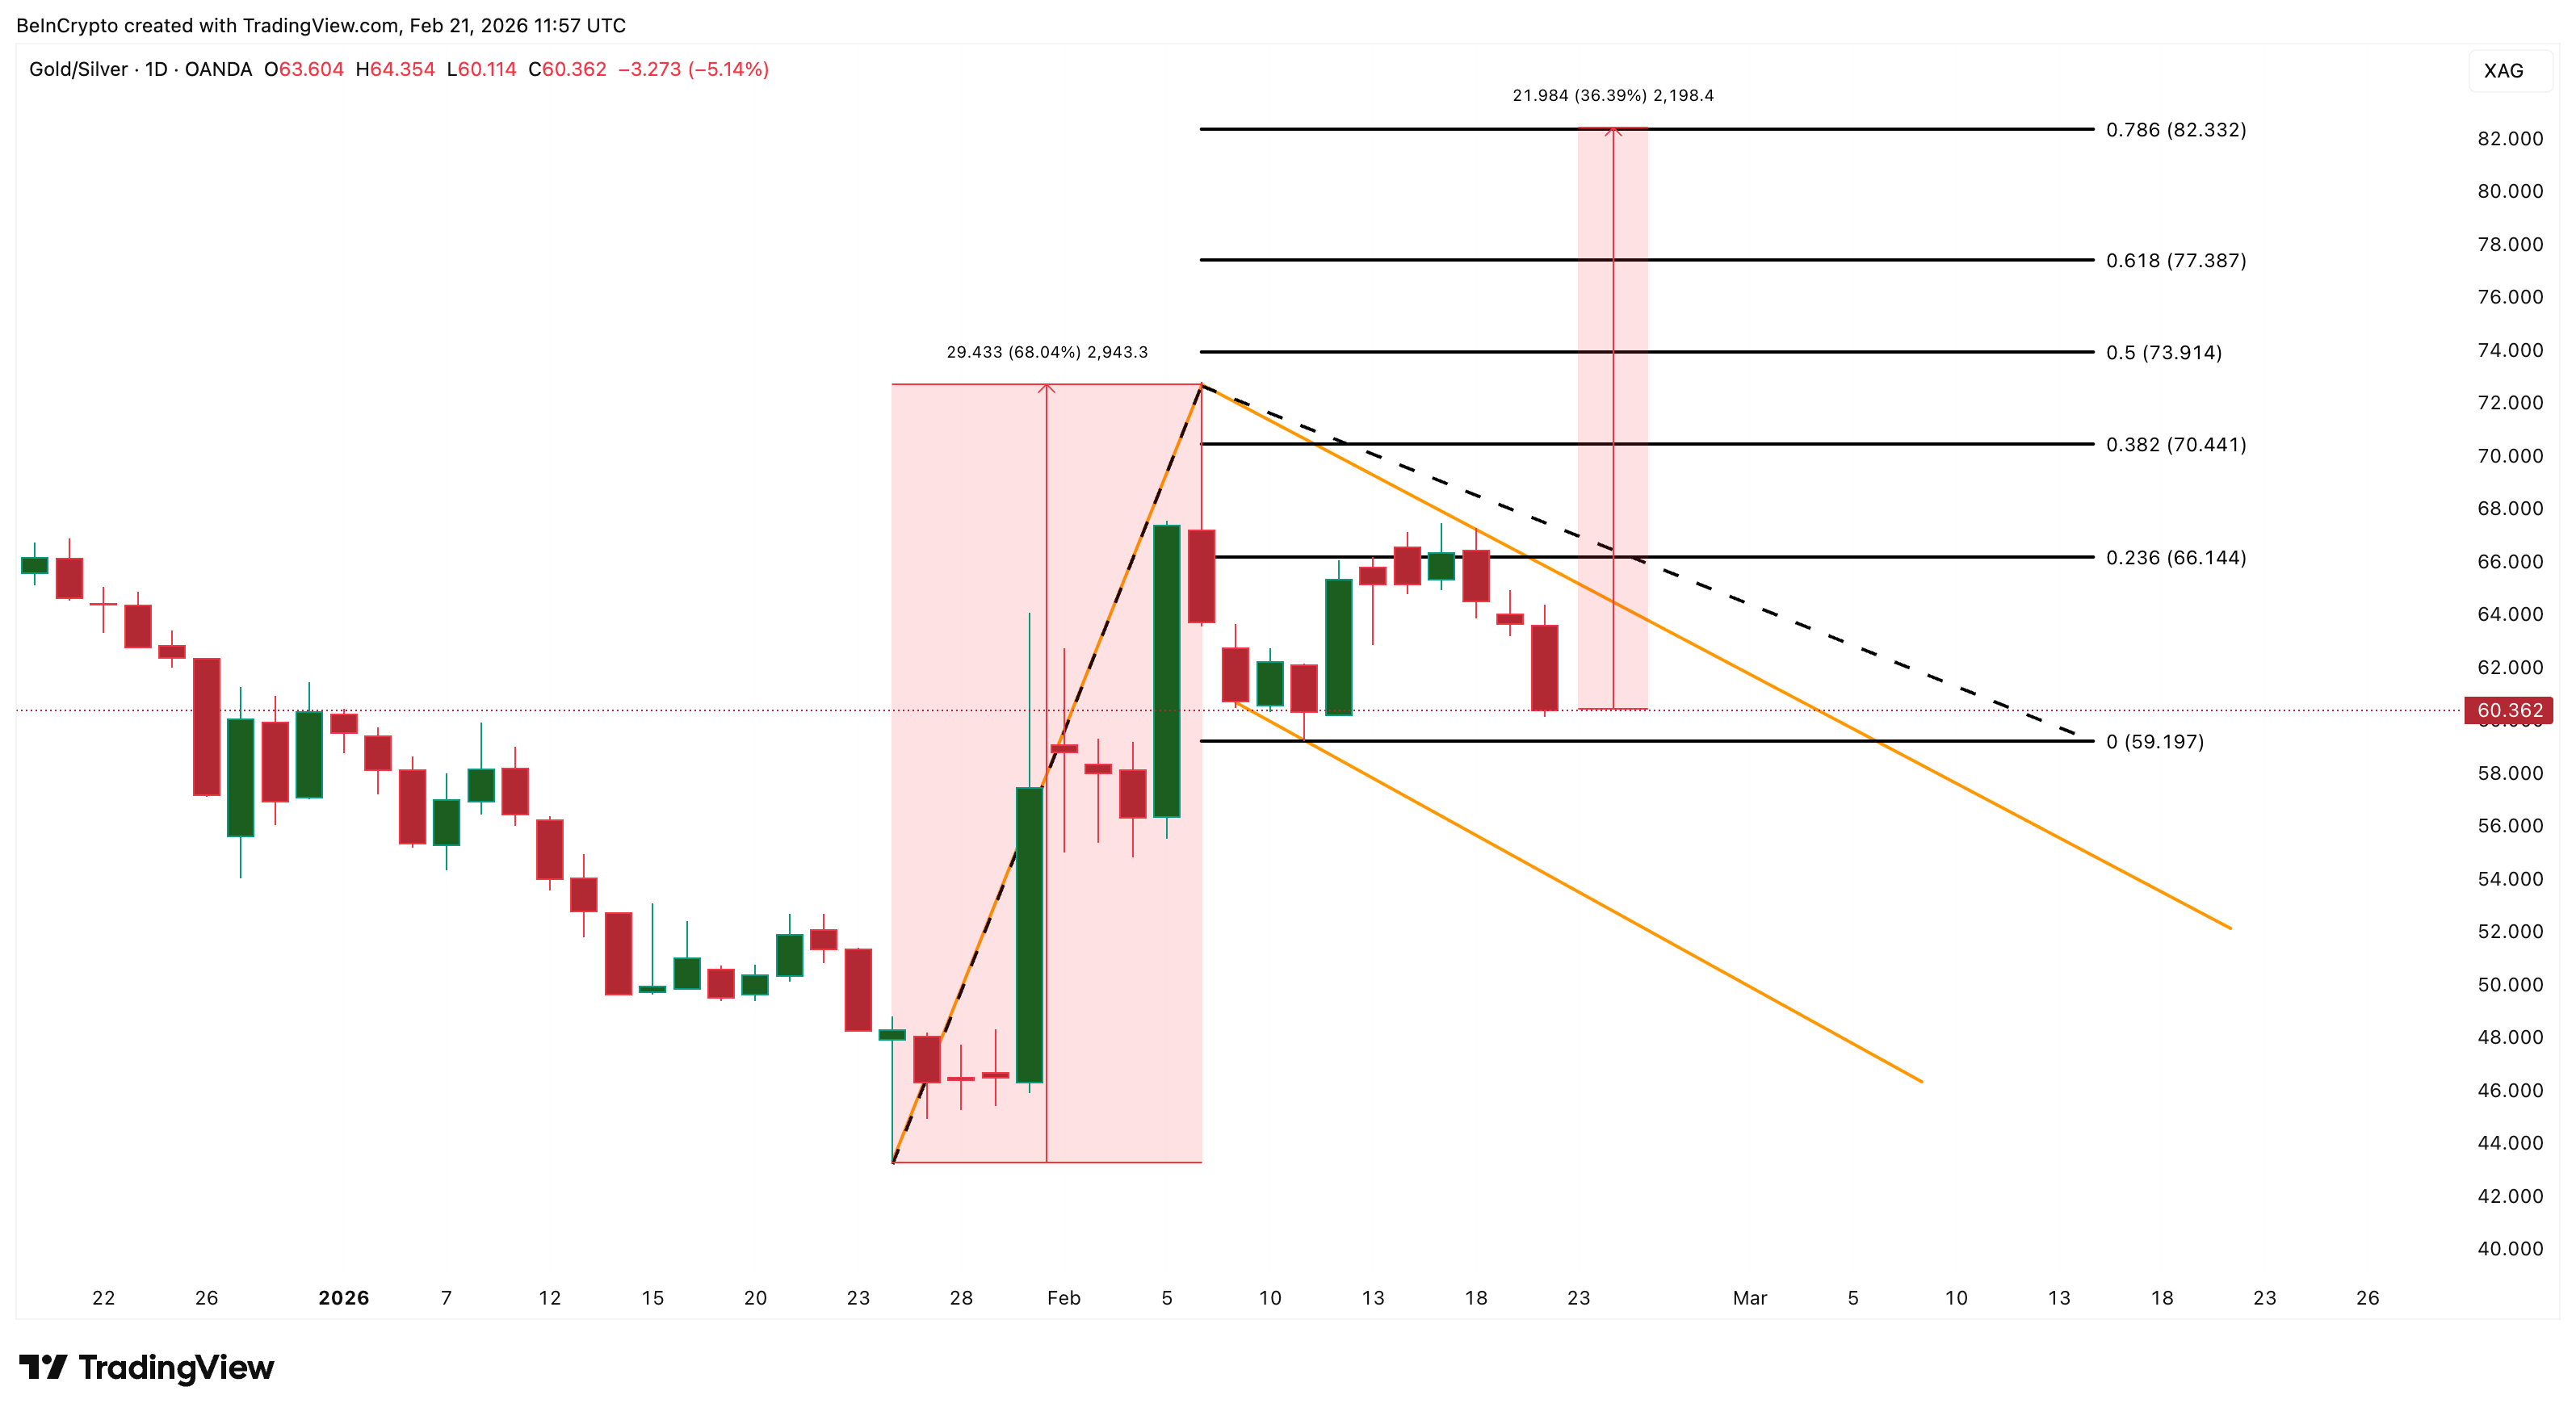
This could either cap silver’s upward momentum or cause a pullback. Silver’s outperformance is likely to continue as long as the flag holds without breaking to the upside, but this is a risk to watch for in March.
This tiebreaker is based on the COT (Commitment of Traders) report dated February 17th. Managed money (hedge funds and commodity trading advisors) has a net long position of just 5,472 contracts. During the rally to $121, hedge funds were positioned at multiples of this level.
This low level means that the speculative powerhouses are still on the sidelines, waiting for a firm base before committing capital.
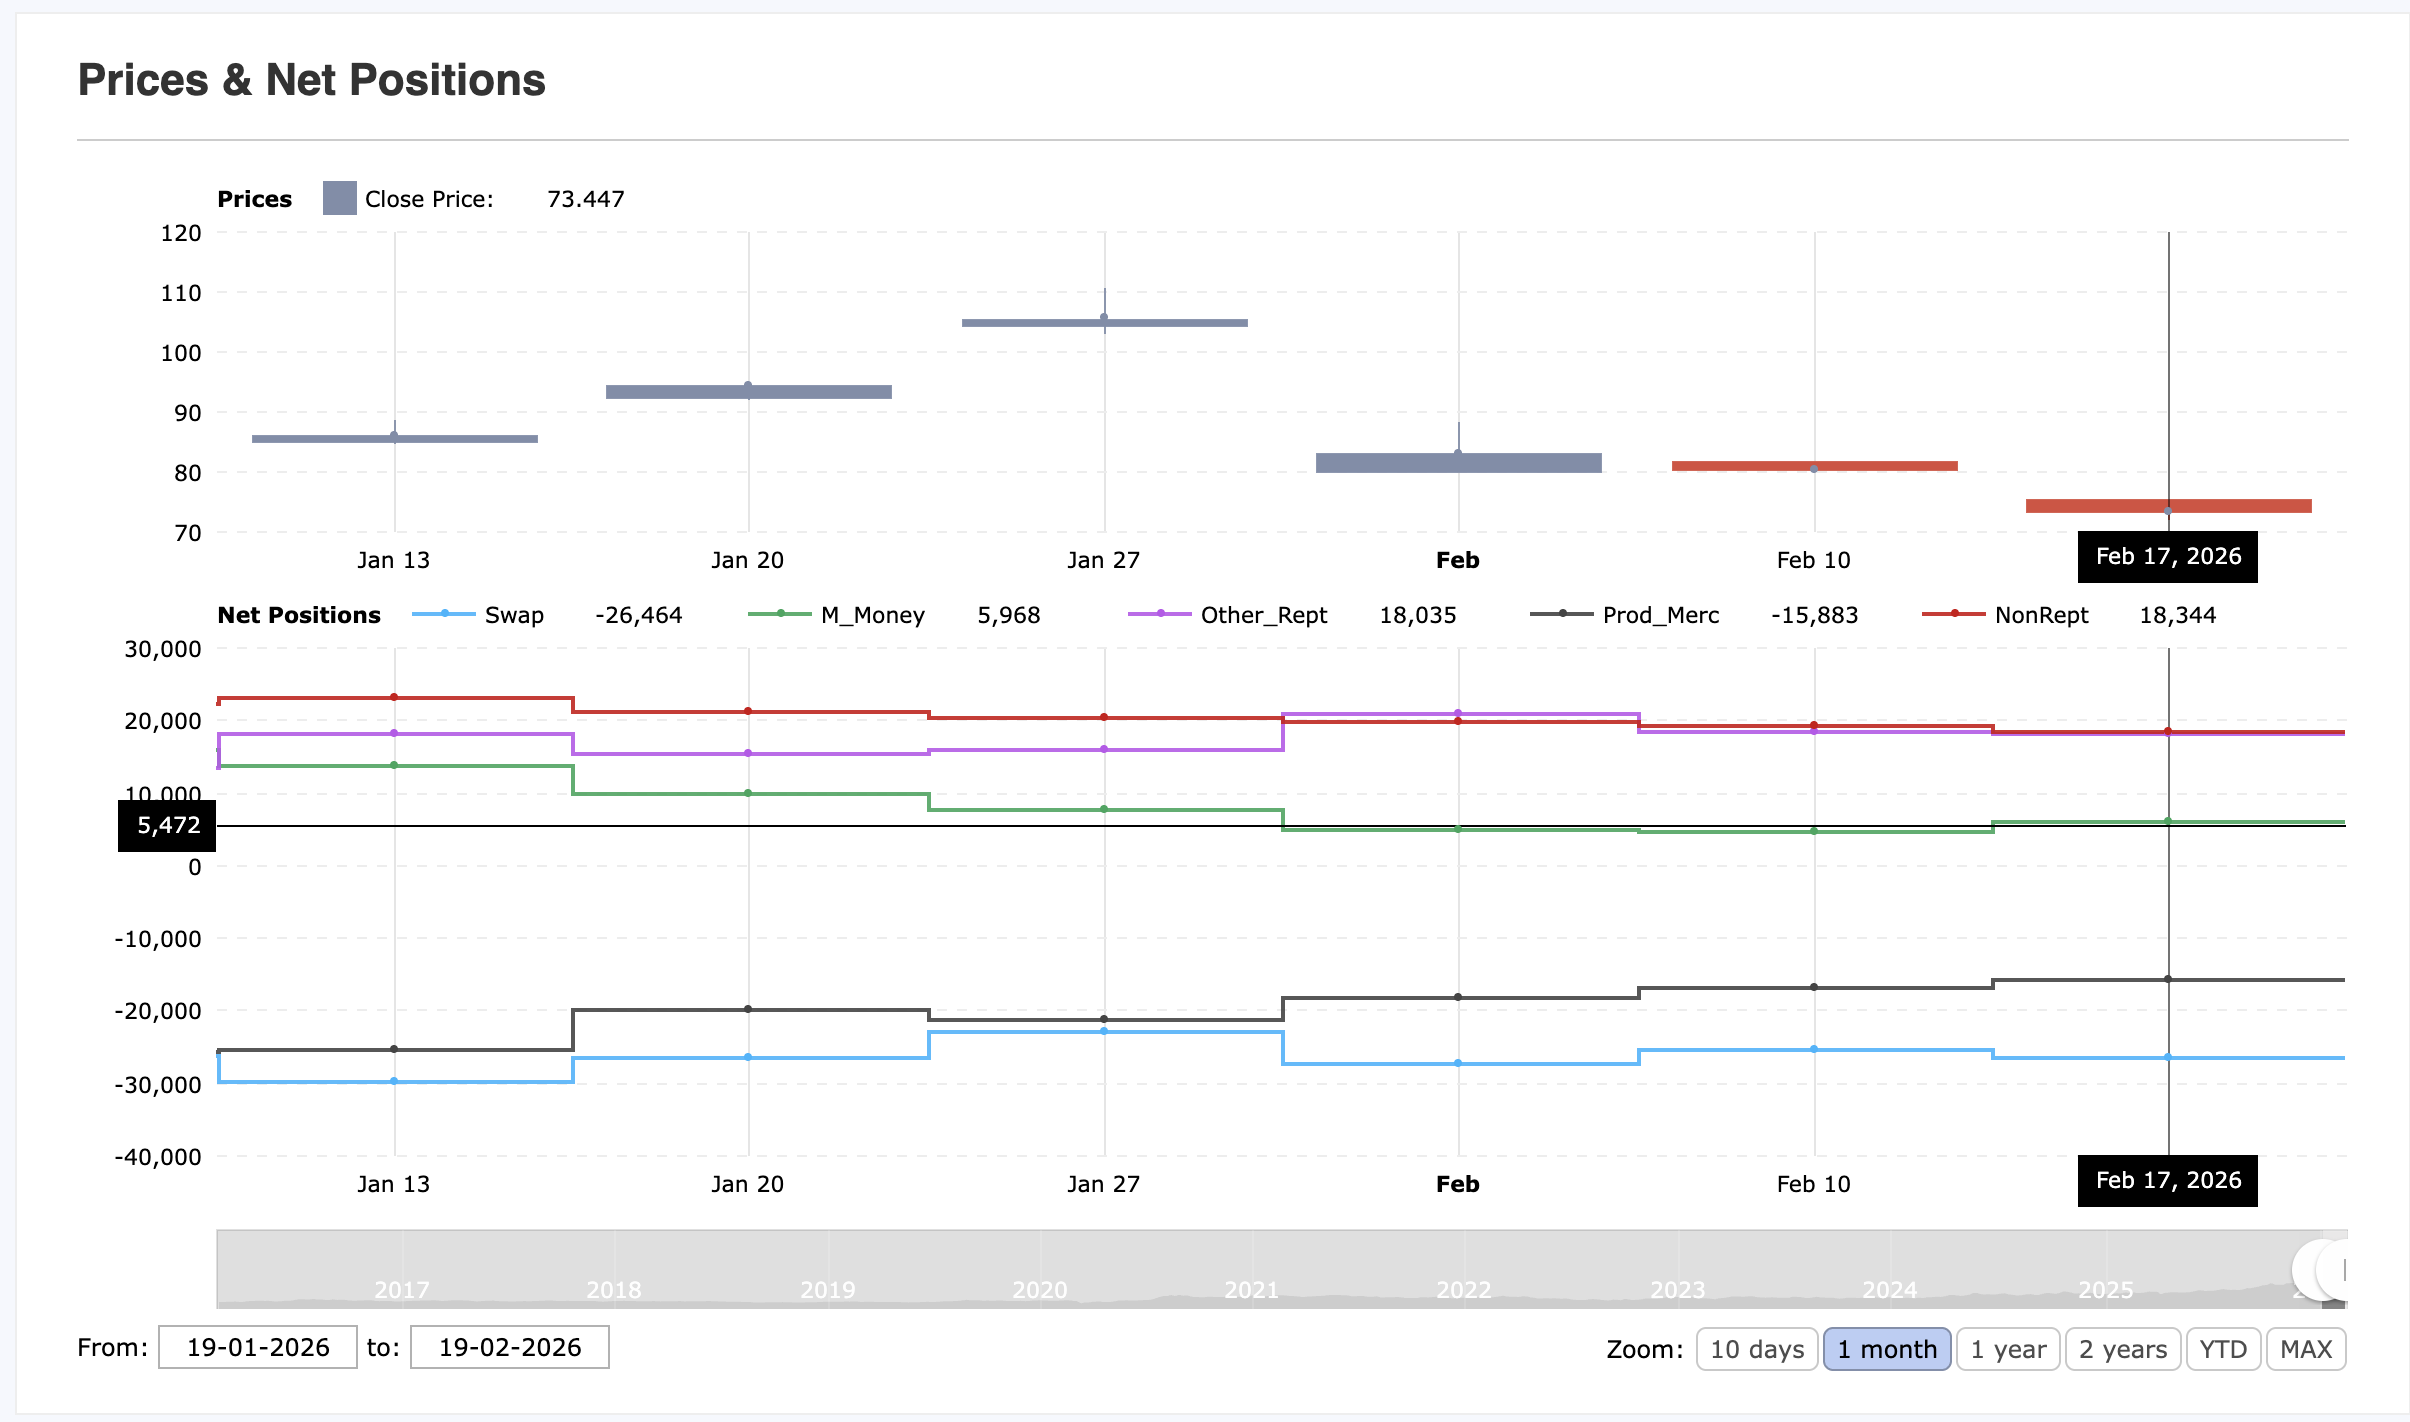
This is both the most bullish medium-term signal and the clearest explanation of short-term sentiment. If hedge funds re-enter the market, there is plenty of room for new institutional investors to buy. However, they need to see a stable base and a clear breakout (likely above $92) before intervening.
Outlook for March 2026: Silver price levels to watch
Four out of seven major indicators are trending bullish. These include miners leading on SIL strength, backwardation confirming the urgency of physical demand, a divergence between the dollar and silver indicating real potential buying pressure, and hedge funds barely having significant room to re-enter.
Additionally, three indicators call for caution. These include reduced COMEX open interest, a hidden bearish divergence, and bullish flags in the gold-silver ratio that threaten to shift momentum back to gold.
Most Likely Path for March: Silver stabilizes between $75 and $92 as the market builds a foundation that gives managed money confidence to re-enter.
A cup-and-handle neckline will be confirmed if the price closes above $84 for the day. A full breakout is confirmed above $91-92, opening the door to $100. Psychologically important levels are likely to be achieved by mid-March.
If the increase in open interest confirms the participation of new institutional investors and the rally continues through March, extension targets of $121 (retesting the all-time high) and $136 (full Fibonacci extension) become realistic.
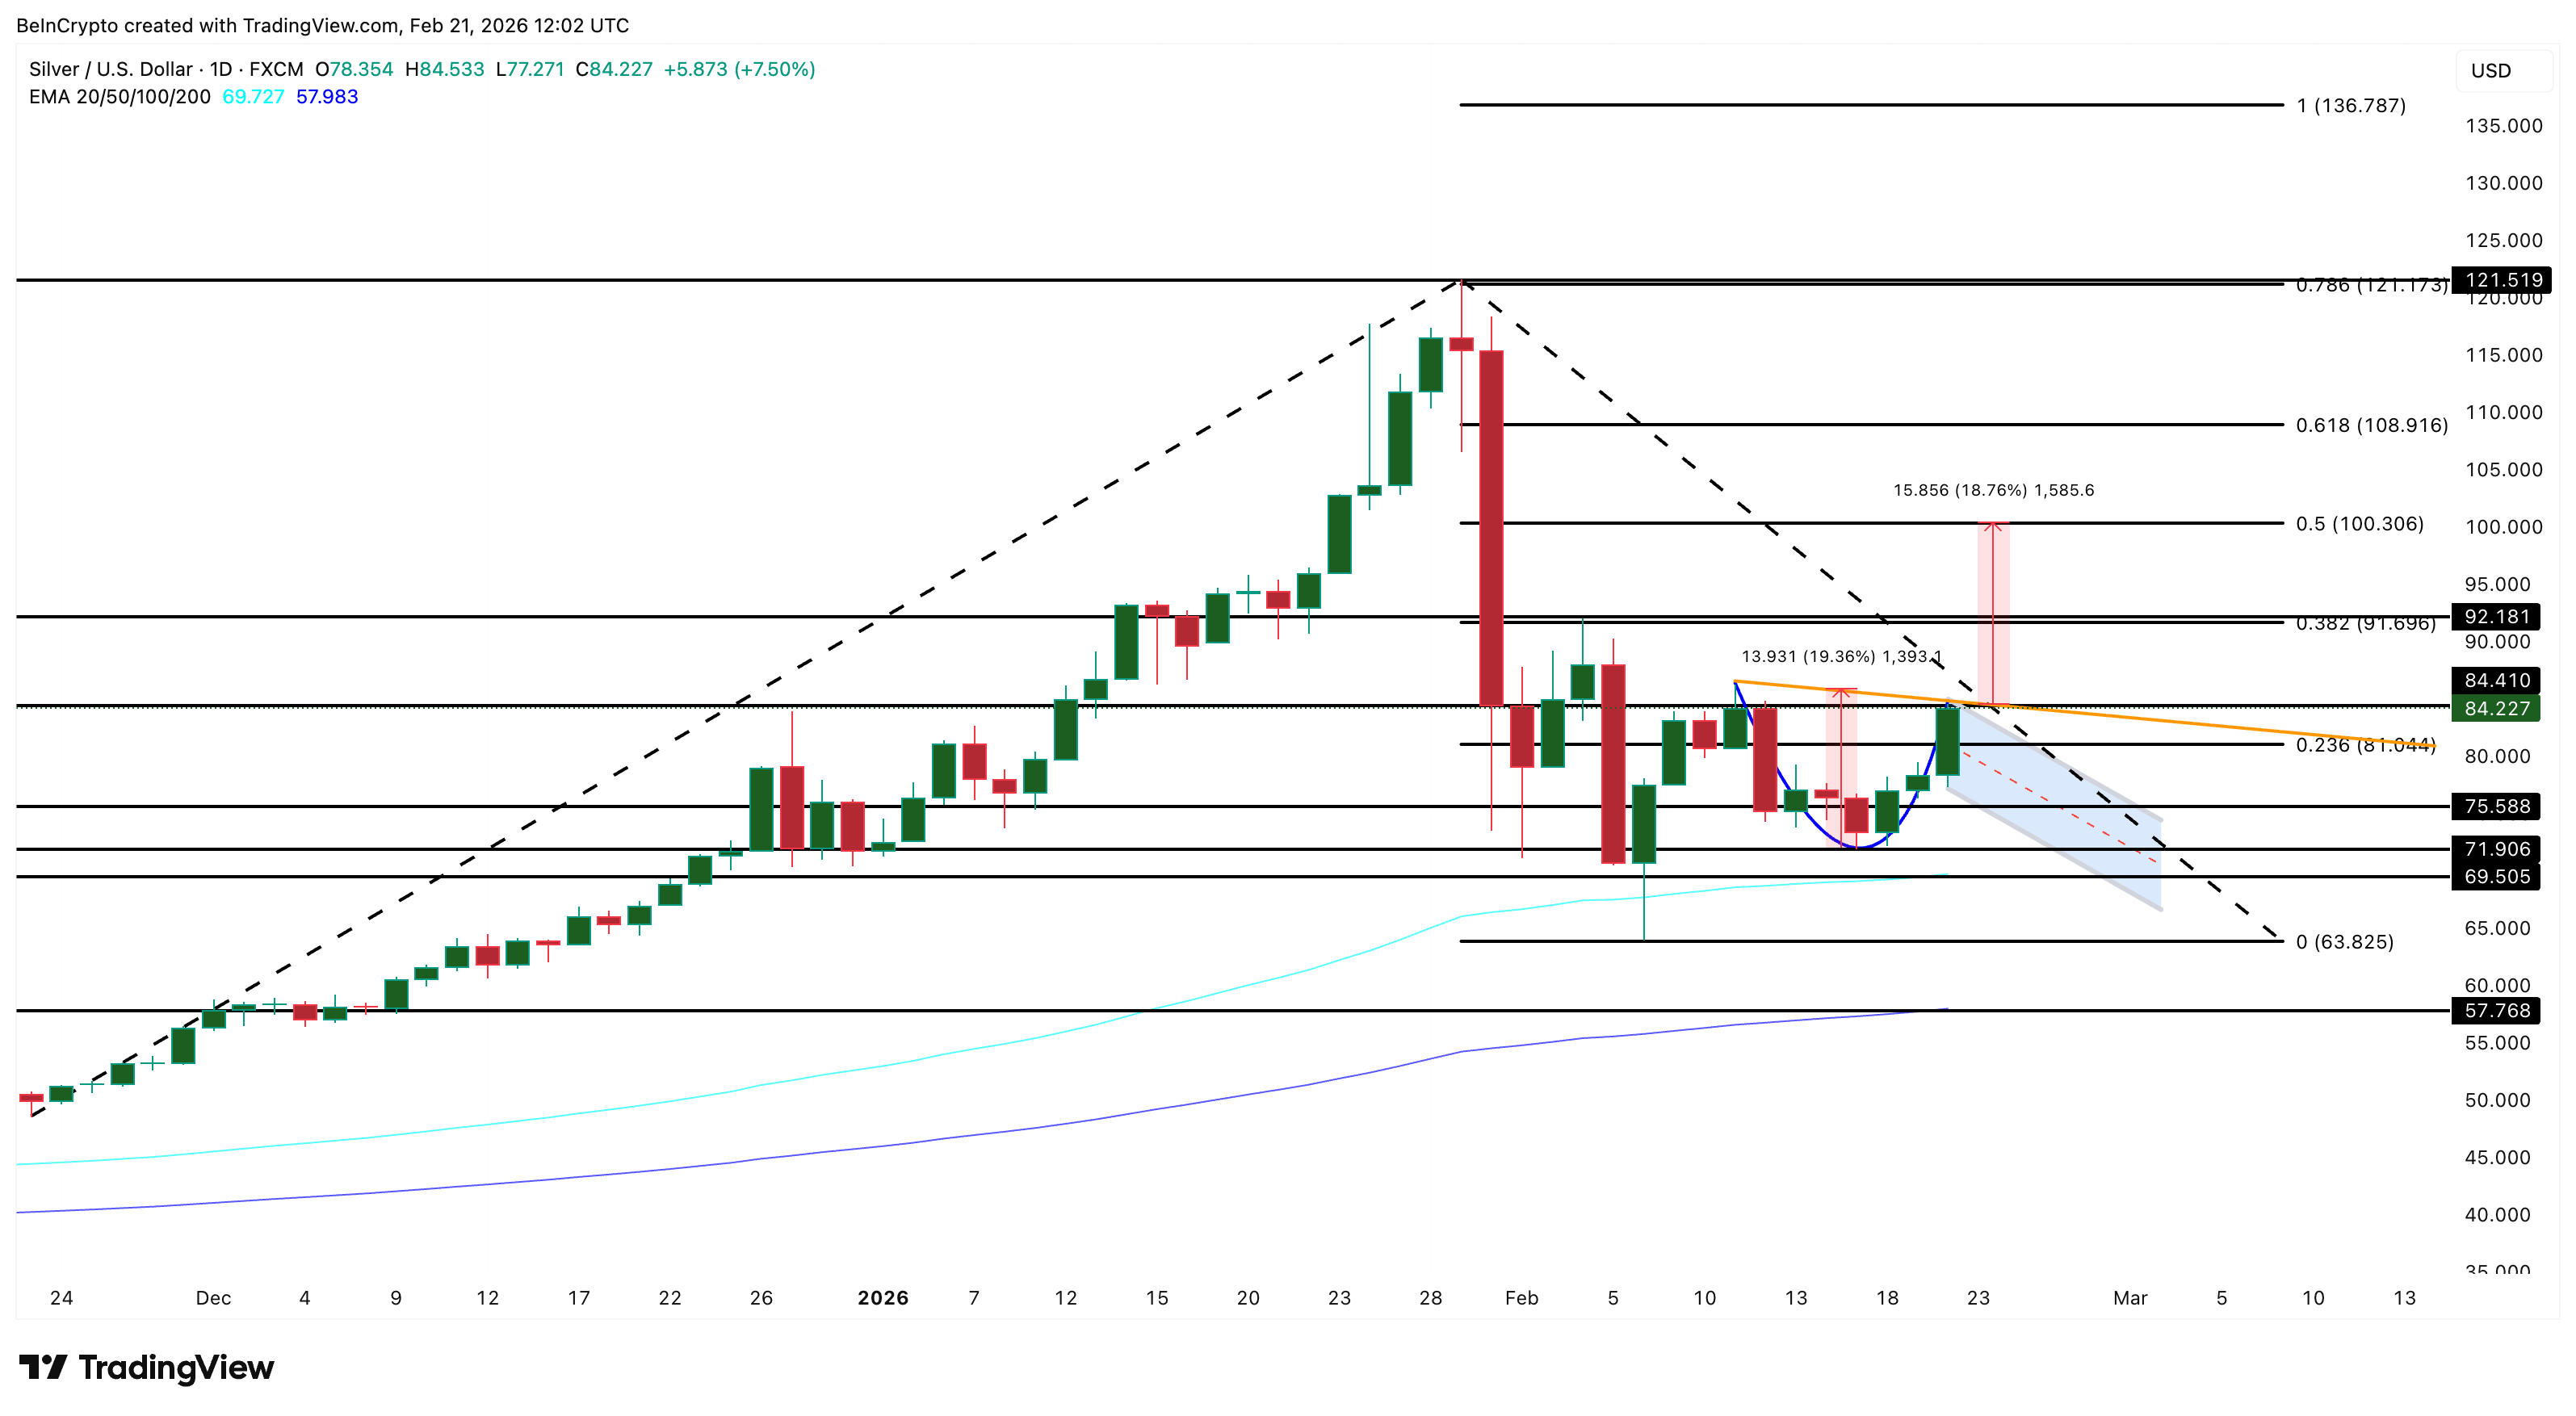
On the downside, $75 is a fine line. If the price closes below $75 for the day, the cup structure will crack, leading to a retest of $71. A loss of $71 completely negates the cup formation and brings the 100-day moving average to $69.
The 200-day moving average below it at $57 represents one of the strongest structural support levels on the chart.
If DXY soars above 100, the bearish scenario gains momentum. Alternatively, the gold-silver ratio could decisively break out of the bullish flag. Or, if future U.S. economic data strengthens the Fed’s stance of raising long-term interest rates, dashing expectations for rate cuts.