

Bitcoin, gold, and silver experienced a sudden spike on Tuesday, the day before the Fed was expected to cut interest rates again.
Despite XAG prices breaking above $60 an ounce for the first time in history and currently up +108% in 2025, the bellwether cryptocurrency and two commodity safe havens, gold and silver, could face volatility surrounding the Fed’s interest rate decisions.
Top price targets for BTC, XAU, XAG ahead of Fed rate cut
All eyes are on tomorrow’s Fed interest rate decision and Jerome Powell’s press conference afterwards. This is one of the most important macroeconomic events for Bitcoin and commodity safe-haven assets this week.
Sponsored Sponsored
Interest rate bettors believe there is an 87.6% chance the Fed will cut rates, according to data from the CME FedWatch tool.
Fed interest rate cuts are generally a tailwind for Bitcoin as they inject liquidity into financial markets. Gold is typically the cleanest and earliest beneficiary of rate cuts, but silver often initially lags gold, but then outperforms during strong reflationary movements. This is why once silver gains momentum, it tends to have wild upward movements after cuts.
Gold is the first to react, most predictably Bitcoin gains as liquidity expands, and silver is often the winner of late-game momentum.
However, based on current price trends, the market has already priced in this event and traders are already ahead of a rate cut in near certainty.
Bitcoin races to $100,000 before Fed interest rate decision
Bitcoin price has been trading with a bullish bias since bottoming at $80,600 on November 21st and has stabilized within an ascending parallel channel. As long as the price remains within this technical formation, further upside potential remains.
Based on the RSI (Relative Strength Index) indicator, momentum is building and could push BTC further north. A position above the 50 threshold suggests strong buying momentum, but much remains in the balance as this midline level is susceptible to bearish acquisitions.
Bitcoin price faces immediate resistance at the 50-day exponential moving average (EMA) of $97,015, which is blocking BTC to the most important Fibonacci retracement level of 61.8% at $98,018.
Sponsored Sponsored
This will be an important entry point for late bulls, so if Bitcoin price cleanly breaks above the level with strong volume, it will signal an uptrend. This directional bias will push the Pioneer cryptocurrency to $103,399, which is dominated by the 50% midrange.
In a very bullish case, BTC could reach the 38.2% Fibonacci retracement level, indicating a strong trend.
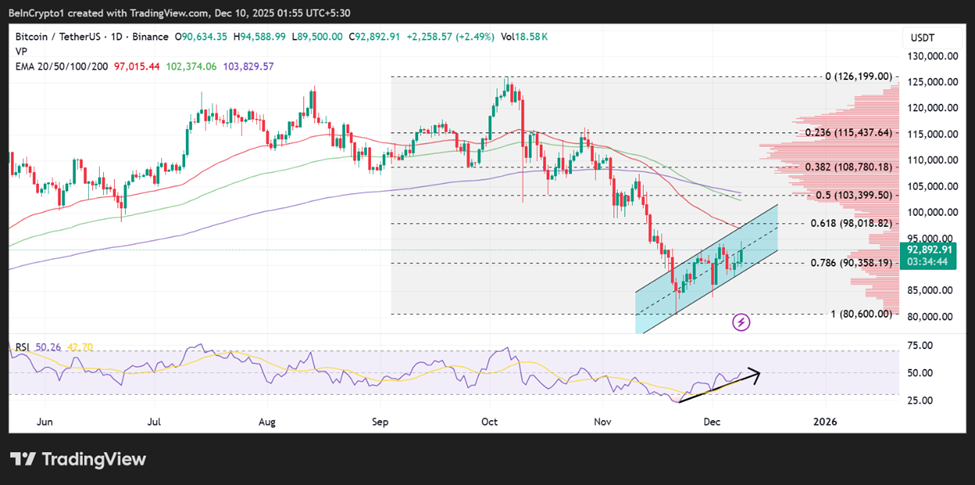
Conversely, if the 61.8% Fibonacci retracement level holds as resistance, a trend reversal trend will be set.
For sellers pulling the trigger at current levels, the 78.6% Fibonacci retracement level could give way as support, which could cause BTC to break out of the ascending parallel channel.
Such a directional bias could send the Pioneer cryptocurrency price towards the $80,600 support floor. Such a move would represent a drop of almost 15% from current levels.
Sponsored Sponsored
Gold can be found in the Classic Reload Zone in Stage A
Gold prices may sell towards the lows of $4,199 and breach the rising support trend line before reversing and rising. Based on RSI, momentum is fading and XAU price is at risk of correction.
However, the price could move higher as the RSI is still above the 50 threshold and the confluence of the 50-day and 100-day EMAs at $4,202 and $4,203 provide strong downside support.
Important support lies between $4,178 and $4,192. If this zone is maintained, the structure of the bull will remain intact.
Meanwhile, the major resistance level is at $4,241, and a significant break above this supplier congestion level is likely to lead to acceleration.
With such directional bias, the target would be $4,260 or, in a very bullish case, $4,300 to a possible return to the all-time high (ATH) of $4,381.
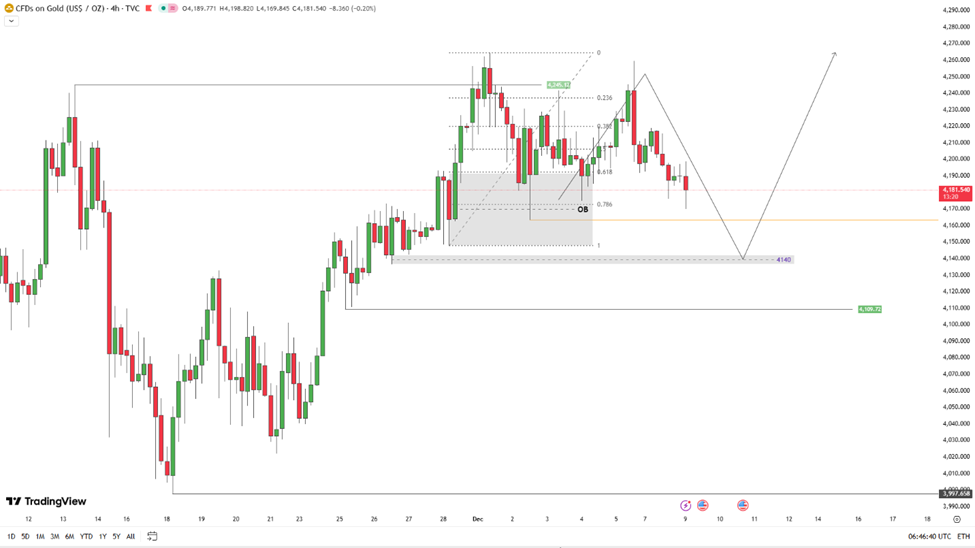
Therefore, the current price level could be a classic reload zone, with every dip providing a buying opportunity for late bulls.
Sponsored Sponsored
Silver is up 6x since the beginning of S&P 500
Silver prices have experienced one of the most powerful bull markets in stock market history, rising six times the year-to-date (year-to-date) rate of the S&P 500. XAG/USD price is currently on track for its biggest 12-month increase since 1979.
After hitting a new all-time high of $60.794, silver is at a price discovery level with further upside potential.
In the 15 minute chart below, the XAG/USD price shows a clean bullish continuation breakout. Silver prices definitively cleared the previous range high near $58.83, accelerating price discovery and confirming the transition from consolidation to expansion.
All major EMAs (50/100/200) are currently bullishly stacked and trending up, indicating strong short-term trend alignment and trend strength.
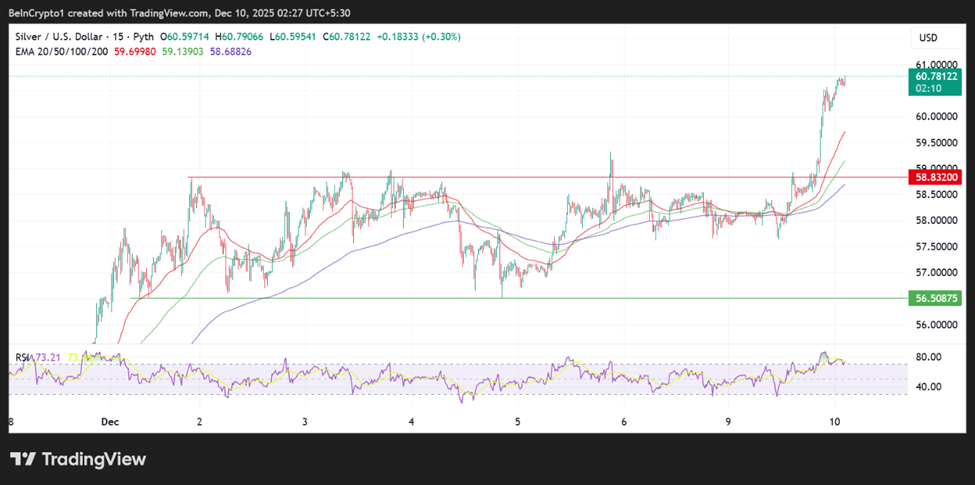
Momentum supports this move as the RSI is above 73, indicating strong buying pressure. However, this RSI position also warns of the risk of short-term overheating and a shallow pullback or consolidation before continuing.
Structurally, the previous resistance at $58.80-$59.00 now acts as initial support, with the next psychological and technical objective around $61.00-$61.50.
As long as silver prices remain above the rising 50-EMA (red), the buy-on-the-touch bias remains, and downside risk only increases if the price continues to fall below $59.00.