

Bitcoin (BTC) continues to trade within its recent consolidation, hovering around $90,000 at the time of writing on Friday, as investors digest the Federal Reserve’s cautious December interest rate cut and its impact on risk assets.
BTC price action approaches an important downtrend line that could determine its next direction. Meanwhile, institutional inflows into Spot Bitcoin ETFs showed modest inflows, with Strategy Inc. adding more BTC to its treasury reserves.
Fed Policy Direction Will Cause Bitcoin Consolidation
Bitcoin price started the week strong, extending its weekend recovery in the first half of the week, topping $92,600 on Tuesday.
However, momentum weakened on Wednesday, with Bitcoin closing at $92,015 after the Federal Open Market Committee (FOMC) meeting.
In a widely anticipated move, the Fed cut interest rates by 25 basis points. However, there was a hint that the FOMC meeting could be adjourned in January.
Sponsored Sponsored
Policymakers expected a reduction in the overall outlook for 2026 by just a quarter of a percentage point, adding to the cautious tone. This was the same outlook as in September, but market expectations of two interest rate cuts have subsided, contributing to short-term pressure on risk assets.
The Fed’s cautious stance, coupled with Oracle’s disappointing performance, led to a temporary risk-off move.
All these factors weighed on riskier assets, causing the largest cryptocurrency by market cap to drop to a low of $89,260, before rebounding to close above $92,500 on Thursday.
In the absence of any major US economic data coming out, the crypto market will look to FOMC members’ speeches and broader risk sentiment for direction.
At the end of the week.
Unless a significant catalyst emerges, BTC is likely to remain strong in the short term.
Russia and Ukraine uncertainties limit risk-on momentum
On the geopolitical front, US President Donald Trump is “extremely frustrated” with Russia and Ukraine and does not want further dialogue, his spokesman said on Thursday.
Earlier, Ukrainian President Volodymyr Zelenskiy said the United States was pressuring his country to cede land to Russia as part of a deal to end nearly four years of war.
These prolonged geopolitical tensions and stalled peace talks continue to weigh on global risk sentiment, limiting risk-on appetite and contributing to Bitcoin’s consolidation so far this week.
There are signs of gradual improvement in demand from institutional investors.
Institutional demand for Bitcoin is showing signs of modest improvement.
The U.S.-listed Spot Bitcoin ETF recorded total inflows of $237.44 million through Thursday, following modest outflows of $87.77 million a week ago, according to SoSoValue data, indicating a slight improvement in institutional investor interest.
However, these weekly inflows are still small compared to the inflows observed in mid-September. For BTC to continue its recovery, ETF inflows need to strengthen.
Sponsored Sponsored
On the corporate side, Strategy Inc. (MSTR) announced on Monday that it bought 10,624 Bitcoins between December 1st and 7th for $962.7 million, at an average price of $90,615.
The company currently holds 660,624 BTC worth $49.35 billion. This strategy still has ample capacity to raise additional funds, potentially allowing for even larger Bitcoin accumulations.
On-chain data shows selling pressure easing
CryptoQuant’s weekly report on Wednesday highlights that selling pressure on Bitcoin is starting to ease.
The report notes that foreign exchange deposits eased as major companies reduced remittances to exchanges.
The graph below shows that the share of total deposits from major players has fallen from a 24-hour average high of 47% in mid-November to 21% as of Wednesday.
At the same time, the average deposit amount decreased by 36% from 1.1 BTC on November 22nd to 0.7 BTC.
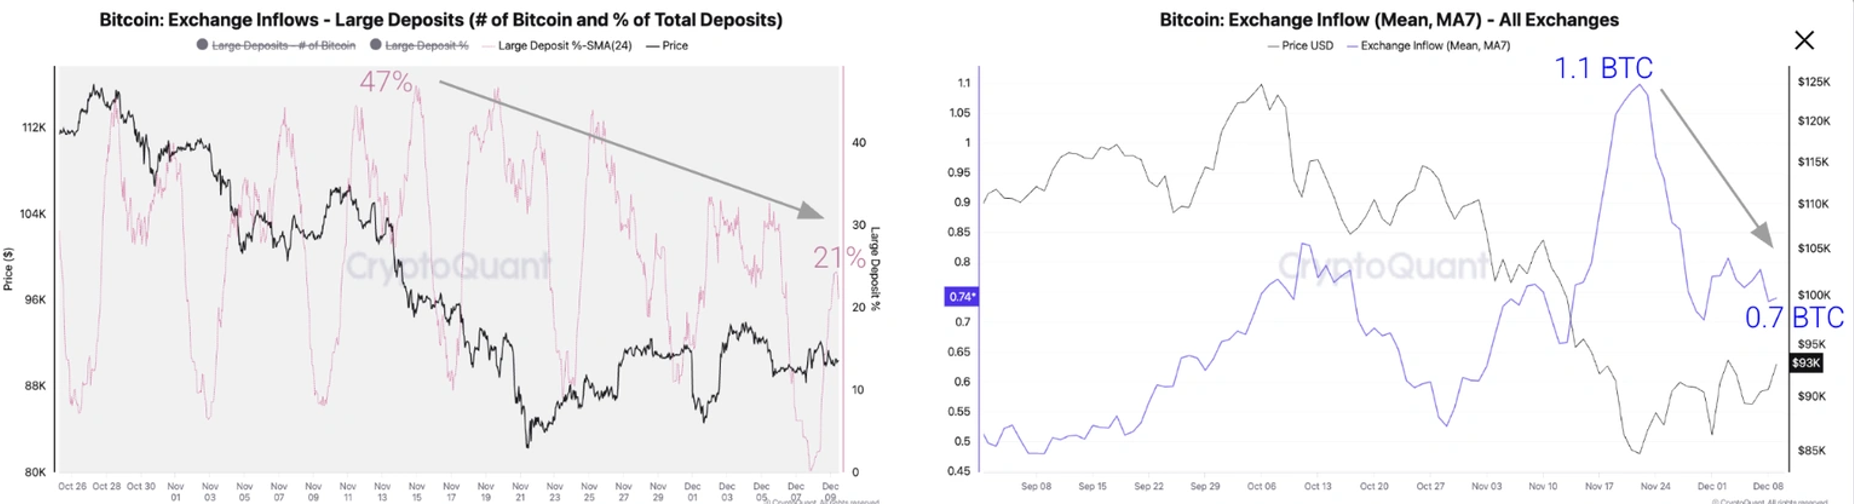
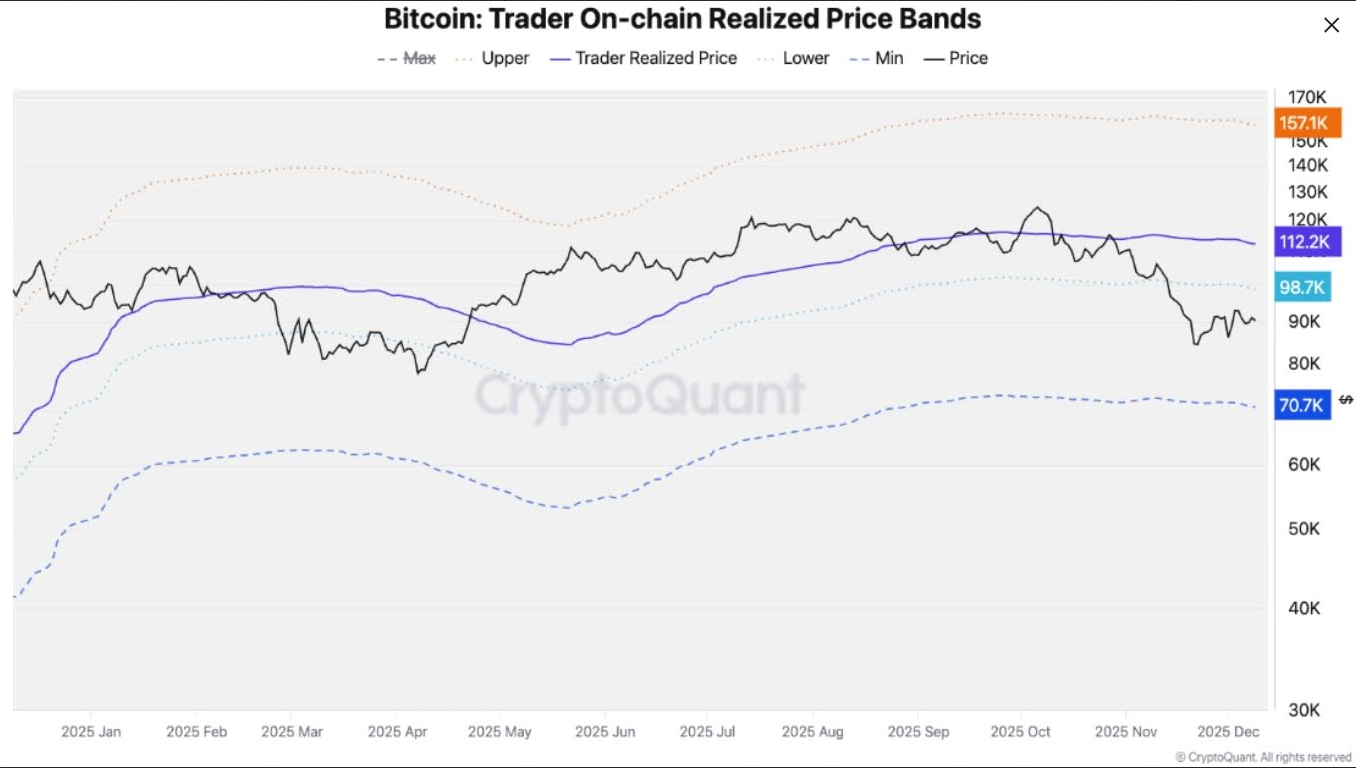
CryptoQuant concludes that if selling pressure remains low, a bailout rebound could push Bitcoin back to $99,000. This level is the lower bound of the trader’s on-chain realized price band and represents price resistance in a bear market.
Above this level, the key price resistances are $102,000 (1-year moving average) and $112,000 (traders’ on-chain realized price).
The Copper Research report also suggested optimism about Bitcoin. This report suggests that BTC’s four-year cycle is not over yet. Replaced.
Sponsored Sponsored
Since the launch of spot ETFs, Bitcoin has demonstrated a repeatable cost-based return cycle, as shown in the graph below.
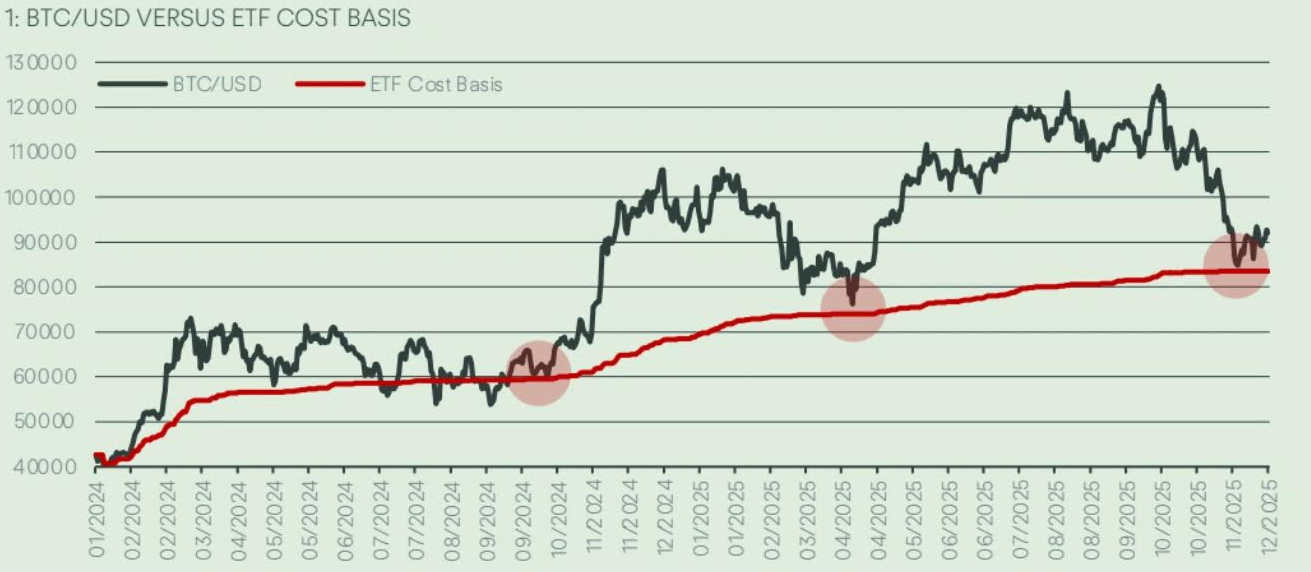
“Since the launch of the spot ETF, Bitcoin has been on a repeatable mini-cycle of returning to its cost base and then rebounding by about 70%,” Fadi Abu-Alfa, head of research at Copper, told FXStreet.
BTC is currently trading around $84,000 in cost terms, and this pattern suggests it could cross $140,000 in the next 180 days.
If the cost basis increases by 10-15%, similar to previous cycles, the resulting premium seen during historical peaks would yield a target range of $138,000 to $148,000.
Will the Bitcoin Santa Rally begin?
Bitcoin fell 17.67% in November, disappointing traders who were hoping for a rally based on the month’s historically strong returns (see CoinGlass data below).
December has historically been a positive month for King Cryptocurrency, with an average return of 4.55%.
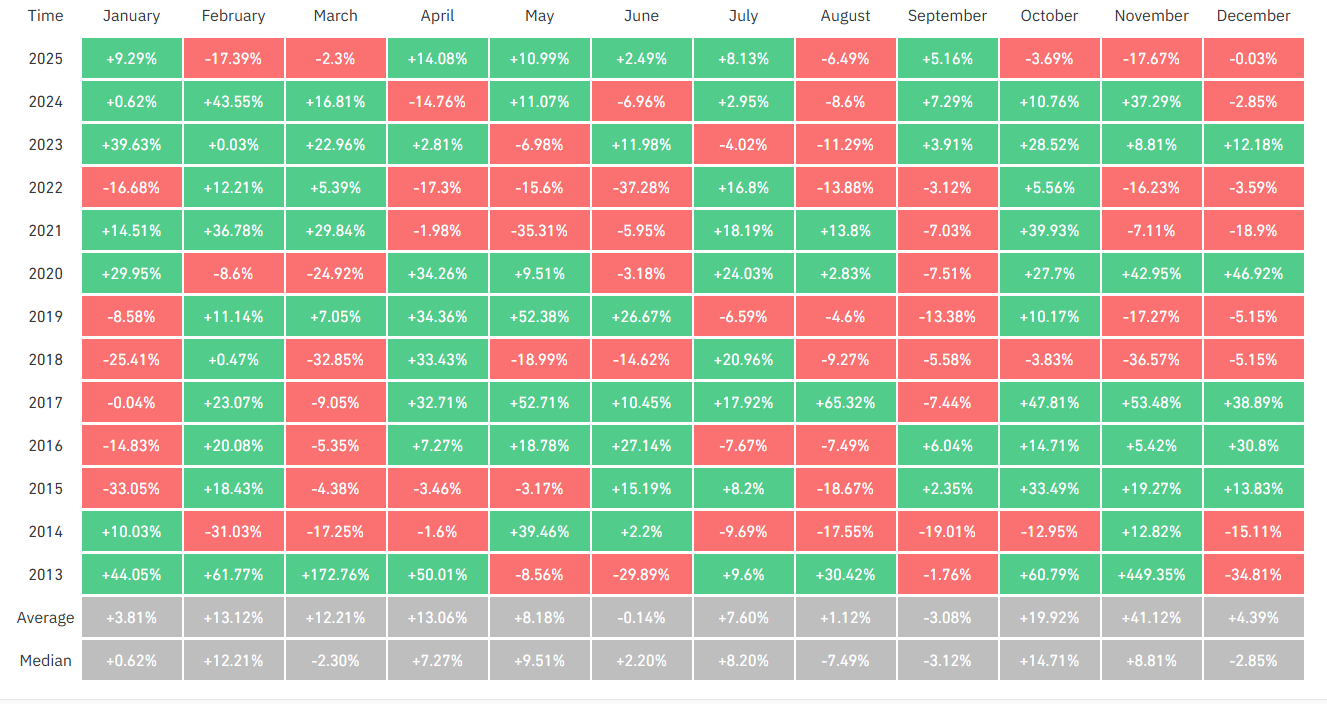
Looking at quarterly data, the fourth quarter (Q4) was the best quarter overall for BTC with an average return of 77.38%.
Still, its performance in the last three months of 2025 has been by far the worst so far, with a loss of 19% so far.
Sponsored Sponsored
Has BTC hit the bottom?
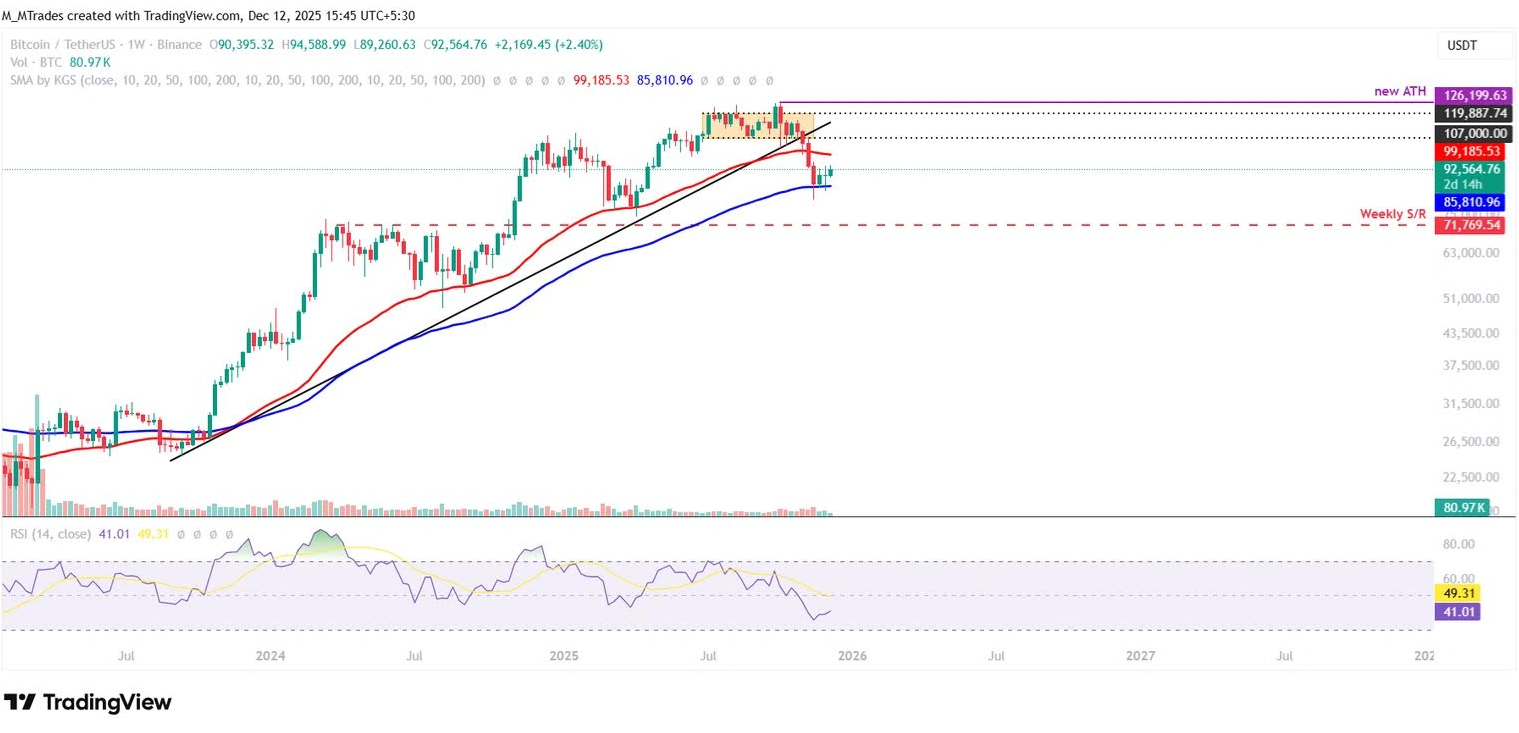
Bitcoin’s weekly chart shows price support near the 100-week exponential moving average (EMA) at $85,809, marking the second consecutive green candlestick following a four-week correction that began in late October.
As of this week, BTC is up slightly and trading above $92,400.
If BTC continues its recovery, the rally could extend towards the 50-week EMA of $99,182.
The Relative Strength Index (RSI) on the weekly chart is reading 40, indicating an upward trend and weakening bearish momentum. For the recovery rally to sustain, the RSI needs to rise above the neutral level of 50.
On the daily chart, Bitcoin price was rejected on Wednesday at the 61.8% Fibonacci retracement level of $94,253 (from the April low of $74,508 to the all-time high of $126,199 set in October).
However, on Thursday, BTC rebounded after retesting the $90,000 psychological level.
If BTC breaks above the downtrend line (drawn by connecting multiple highs since early October) and closes above $94,253.
Once the resistance level is reached, the rally could extend towards the psychological level of $100,000.
The Relative Strength Index (RSI) on the daily chart has stabilized around the neutral 50 level, suggesting a lack of near-term momentum on either side.
To maintain bullish momentum, the RSI must rise above the neutral level.
On the other hand, the Moving Average Convergence Divergence (MACD) showed a bullish crossover at the end of November and it remains intact, confirming the bullish theory.
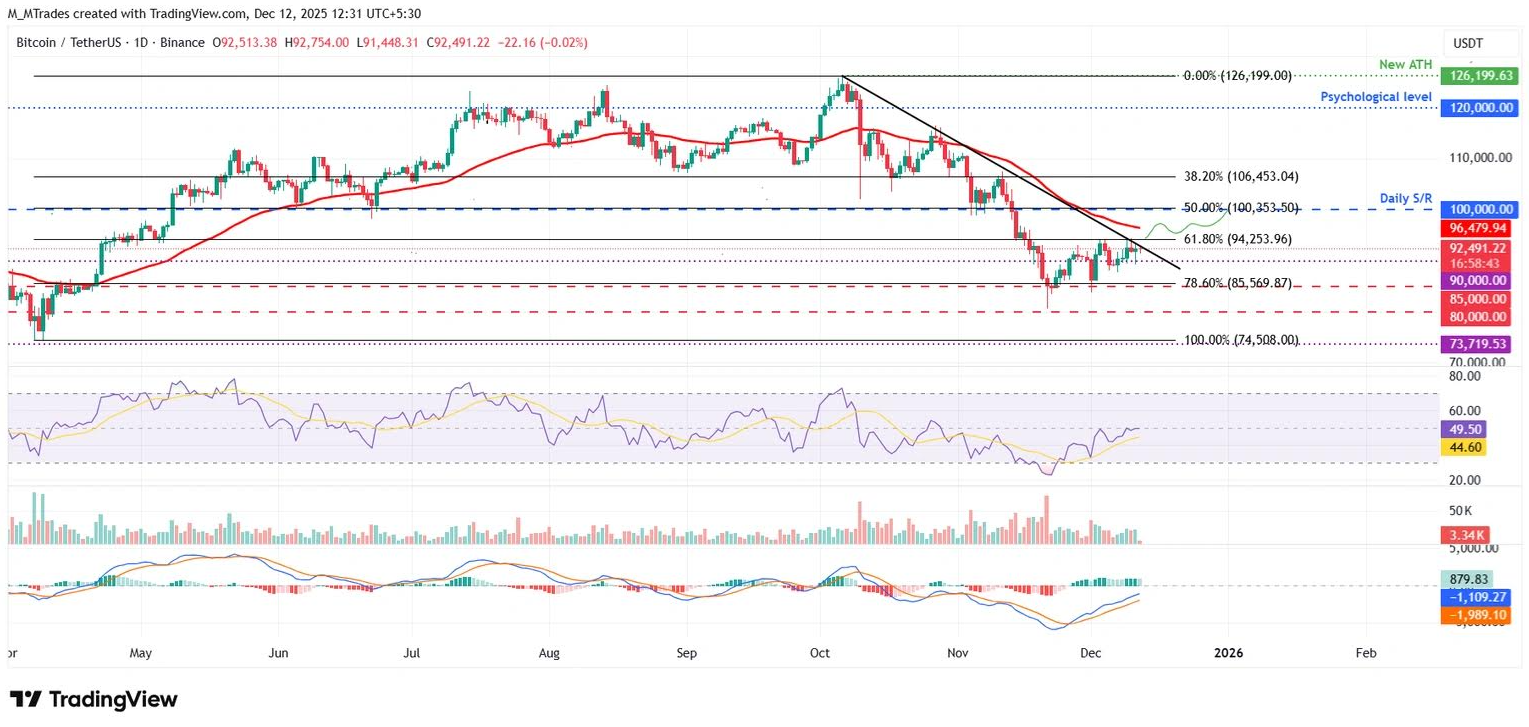
If BTC resumes its downward correction, the first significant support is $85,569, which coincides with the 78.6% Fibonacci retracement level.