

Bitcoin experienced extreme volatility on December 17th, surging more than $3,000 in less than an hour before reversing sharply and falling towards $86,000.
The hard swing didn’t come after the big news. Rather, market data shows that the move was driven by leverage, positioning, and weak liquidity conditions.
Bitcoin rises in short squeeze
The first rally began when Bitcoin rose toward the $90,000 level, a major psychological and technical resistance zone.
Sponsored Sponsored
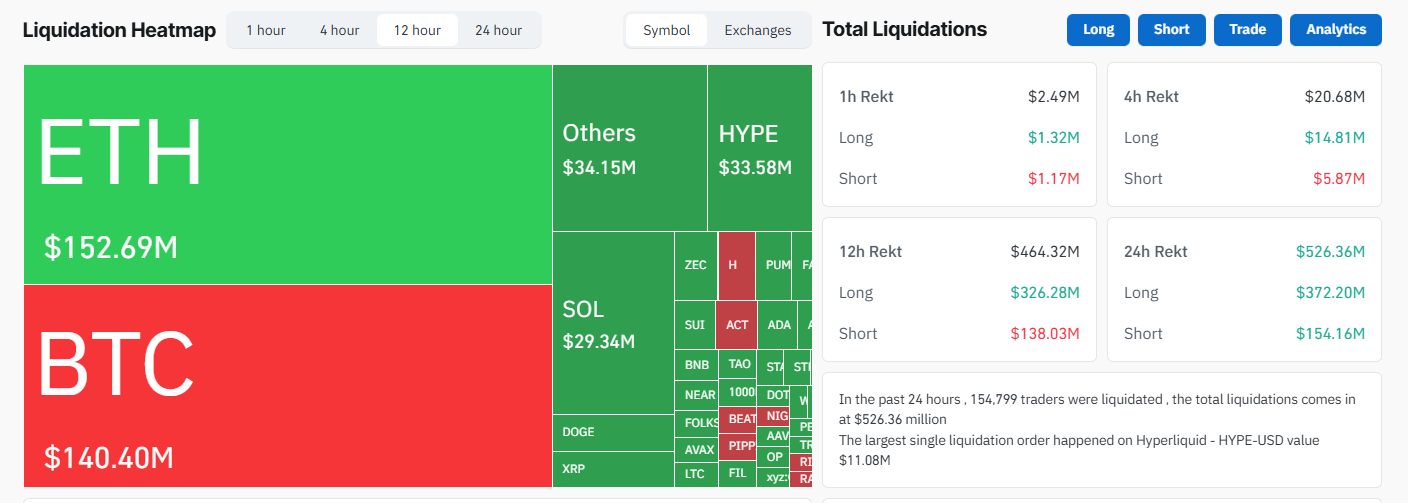
Liquidation data shows a dense cluster of leveraged short positions located above that level. As the price rose, those shorts were forced to close. This process required buying Bitcoin, which caused the price to rise even faster.
About $120 million in short positions were liquidated during the rally. This created a classic short squeeze, where forced purchases accelerate the move beyond what normal spot demand would justify.
At this stage, the move looked strong. However, the structure underneath was weak.
The rally turned into a long liquidation cascade
As Bitcoin briefly regained $90,000, new traders entered the market looking for momentum.
Many of those traders opened leveraged long positions, betting that the breakout would hold. However, the bull market lacked sustained spot buying and quickly stalled.
As prices started to fall, those long positions became vulnerable. When major support levels are broken, the exchange automatically liquidates those positions. What followed was a lengthy liquidation of over $200 million that overwhelmed the market.
Sponsored Sponsored
This second wave explains why the fall was faster and deeper than the first rise.
Within hours, Bitcoin fell towards $86,000, erasing most of the gains.
Positioning data indicates a fragile market environment
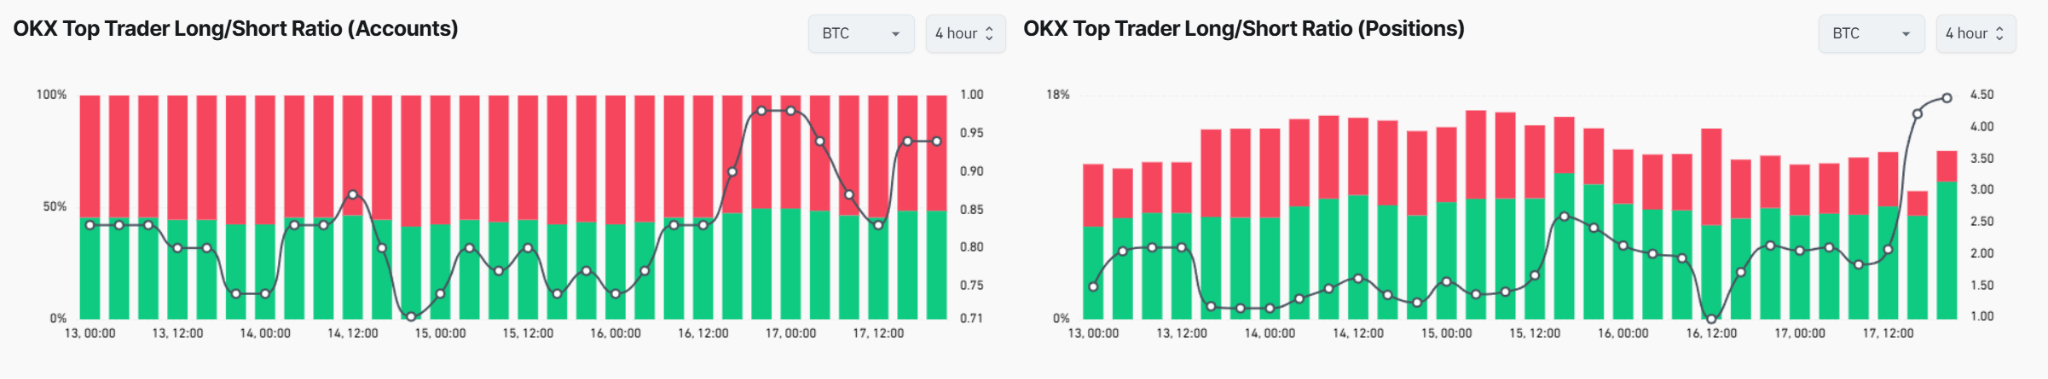
Trader location data from Binance and OKX helps explain why this move was so violent.
On Binance, the number of Longgreen top trader accounts increased sharply ahead of the surge. However, the position size data had low confidence, suggesting that while many traders were long, they were not of large size.
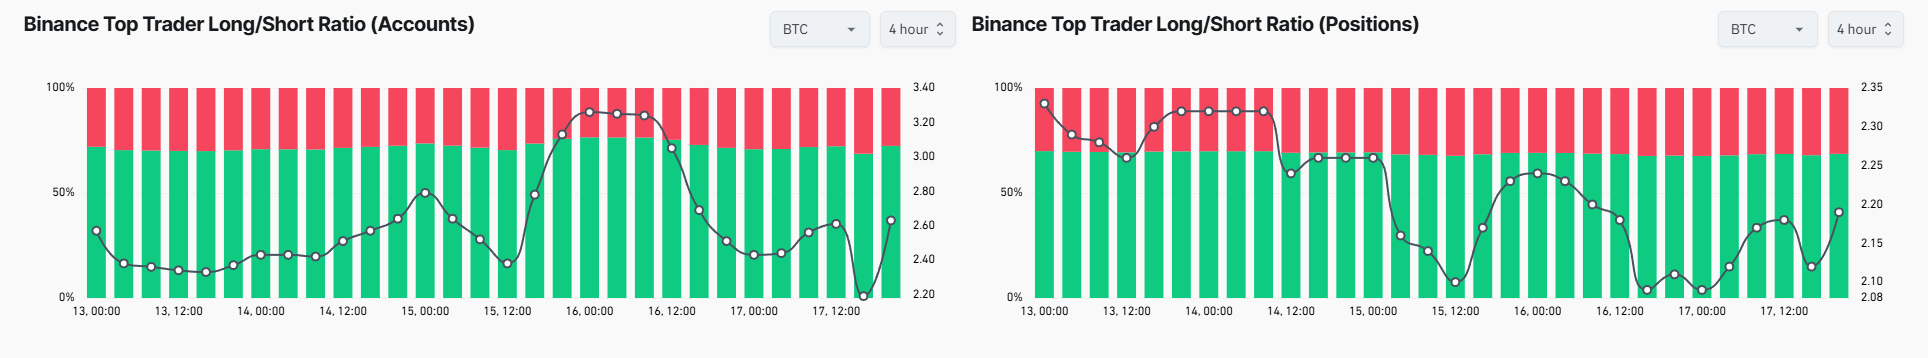
Sponsored Sponsored
In OKX, position-based ratios changed aggressively after volatility. This suggests that large traders were quick to change positions as liquidations progressed, either by buying dips or adjusting hedges.
This combination – crowded positioning, mixed beliefs, and high leverage – creates a market that can move wildly in both directions with little warning.
Did a market maker or a whale manipulate this movement?
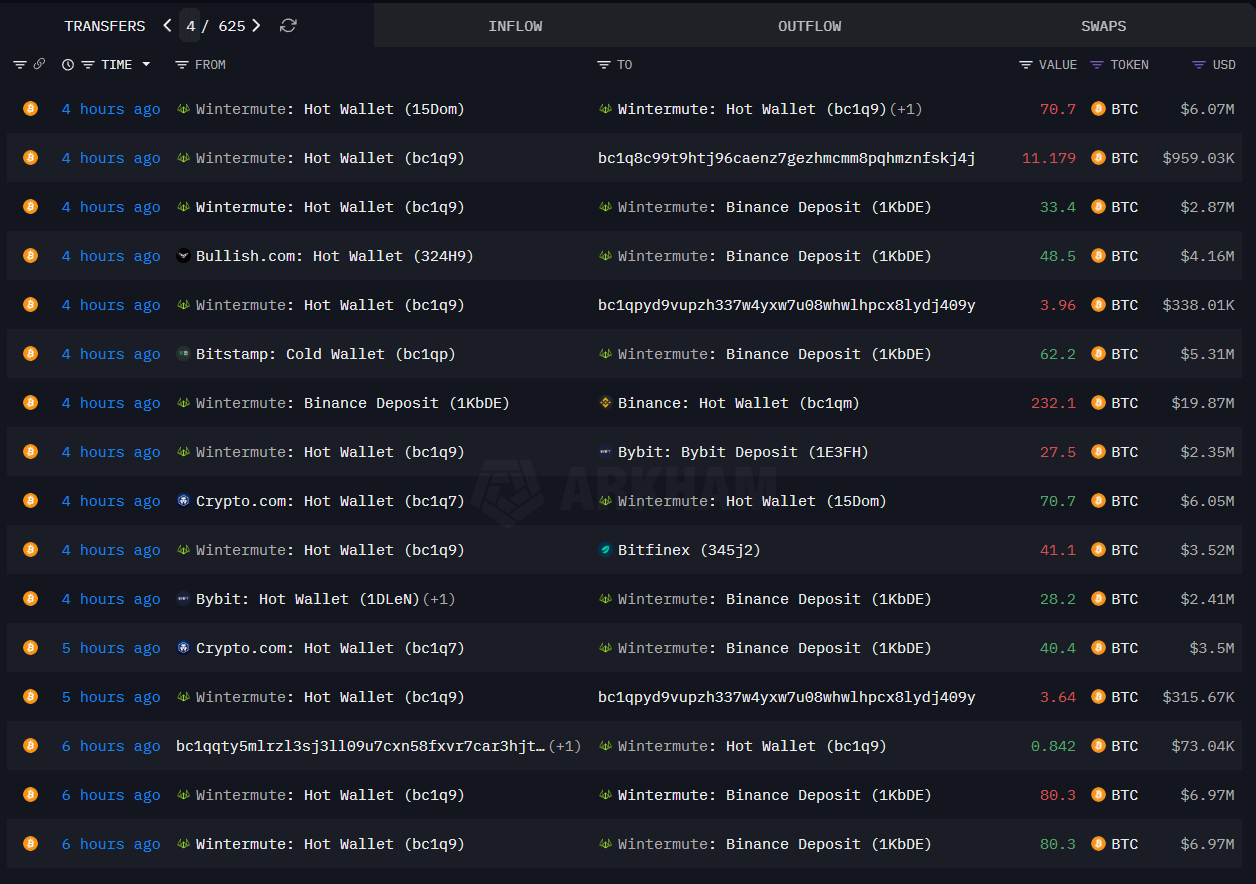
On-chain data revealed that market makers such as Wintermute were moving Bitcoin between exchanges during periods of volatility. These transfers coincided with price movements, but do not prove manipulation.
Market makers regularly rebalance their inventories during periods of stress. Deposits on exchanges may indicate hedging, margin management, or liquidity provision and do not necessarily mean selling at a depressed price.
Importantly, the overall movement can be explained by known market mechanisms such as liquidation clusters, leverage, and thin order books. There is no clear evidence of organized manipulation.
Sponsored Sponsored
What this means for Bitcoin going forward
This episode highlights key risks in today’s Bitcoin market.
Leverage remains high. Liquidity fades quickly during fast movements. When prices approach critical levels, forced liquidations can dominate price action.
During this time, Bitcoin’s fundamentals remained unchanged. This fluctuation reflects fragility in the market structure rather than long-term changes in value.
Similar sharp moves are possible until leverage resets and positioning becomes more sound. In this case, Bitcoin did not rise or fall because of the news.
It fluctuated because leverage forced the price against itself.