

XRP price is once again leaning toward critical levels and has held in this key area after multiple declines this month. The token is trading around $2.40, down nearly 4% this week and 14% in the last month. Although the overall trend remains weak, the $2.28 zone has repeatedly halted deeper breakdowns.
But that floor is now facing its biggest test yet. A broad wave of selling across the cohort is combined with a bearish chart setup. If the sell-off continues to gain momentum, it looks like the key support at $2.28 may not hold.
Sponsored Sponsored
Large investors and whales join the wave of selling
The continuous selling of large wallets began on October 16th. Since then, whales and medium-sized wallets have consistently reduced their holdings, according to the data.
Addresses with more than 1 billion XRP decreased their balances from 26.19 billion to 25.1 billion. They offloaded 1.09 billion XRP (worth about $2.63 billion at current prices).
Medium sized holders (10 million to 100 million XRP) reduced their holdings from 8.28 billion to 8.13 billion, draining approximately 150 million XRP worth approximately $360 million. This week, the price fell by about 4% due to week-on-week selling pressure from XRP whales.
Want more token insights like this? Sign up for Editor Harsh Notariya’s Daily Crypto Newsletter here.
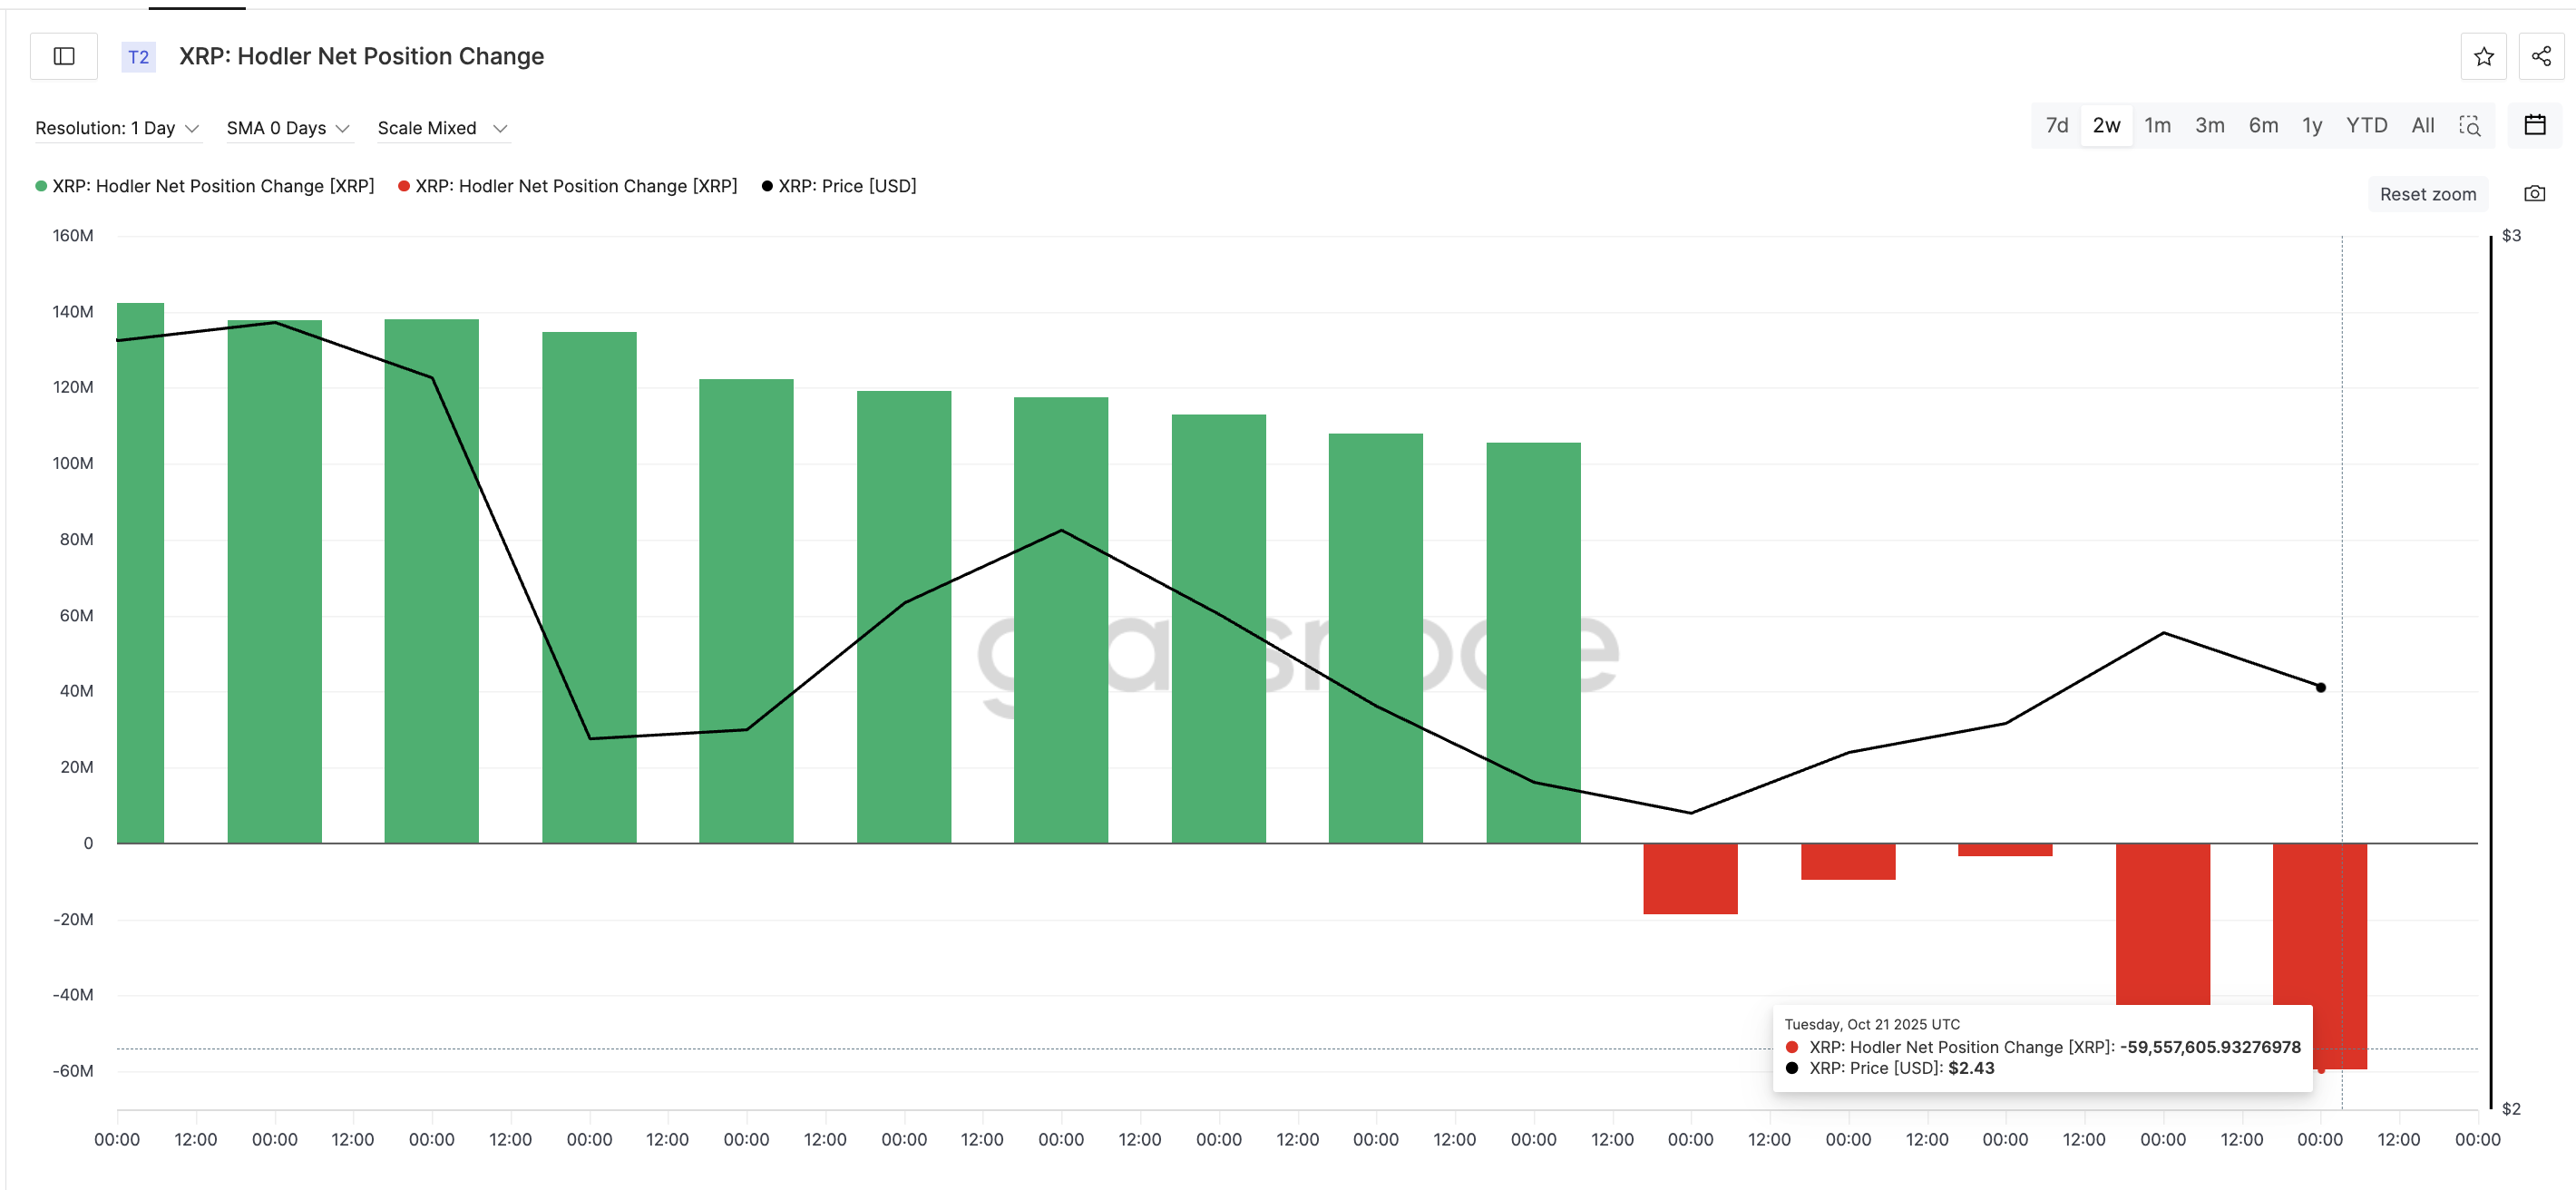
Long-term holders are following a similar path. Hodler Net Position Change, which measures how much long-term investors have added or subtracted their holdings, has deepened into red territory.
Cashouts increased from -18.5 million XRP on October 17th to -59.5 million XRP by October 21st, representing a 220% increase in outflows in four days.
Sponsored Sponsored
This simultaneous decline in whales and holders spurs a broader wave of selling. Until this trend reverses, key XRP support levels are likely to face increasing pressure from both sides of the market.
Selling pressure coincides with bearishness on XRP price chart – 5% decline likely to continue
On the technical side, XRP price continues to trade within a descending triangle, with the strongest horizontal base near $2.28. This formation usually indicates that the sellers have the upper hand until the base gives in.
From October 13th to October 20th, XRP made lower highs, but the Relative Strength Index (RSI), which measures price momentum, hit new highs.
This hidden bearish divergence indicates a weakening of momentum and suggests another leg may follow. If the daily closing price is confirmed and XRP price falls below $2.28 (5% correction), the next XRP-based targets are $2.08 and $1.77 (14% to 27% decline).
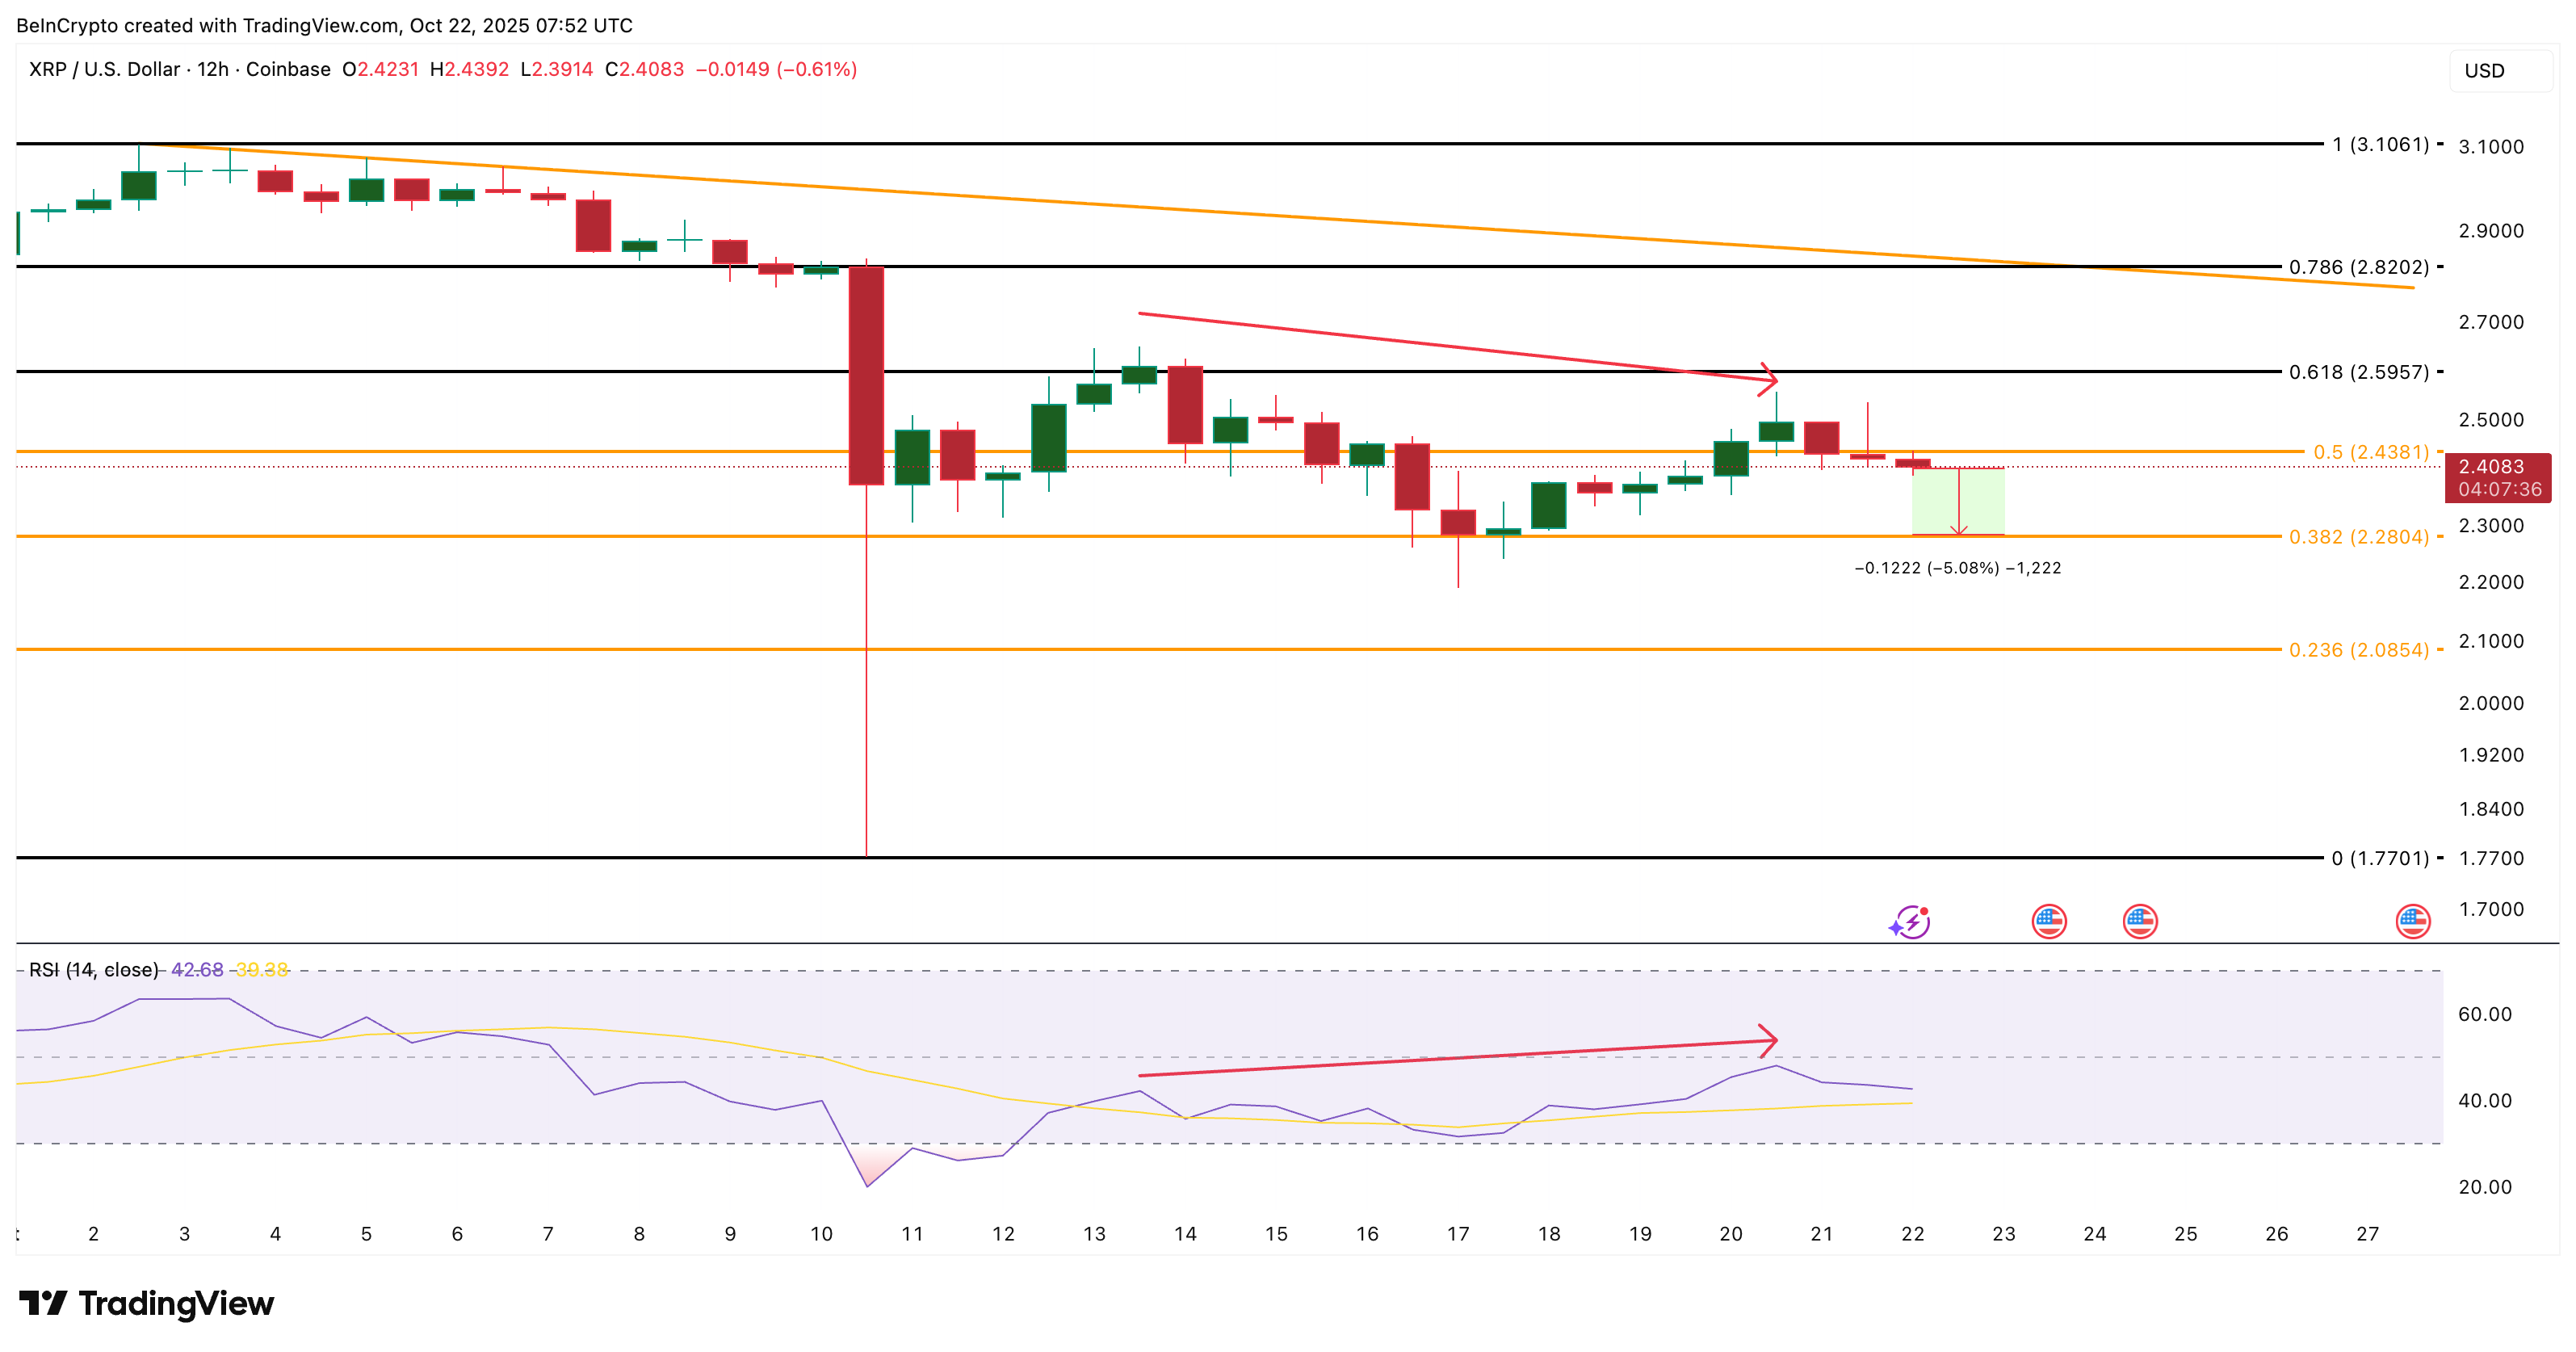
On the upside, a sustained break above $2.82 would invalidate the bearish XRP price structure and leave room for a rebound towards $3.10.
For now, XRP price is caught between an aggressive wave of selling and a critical floor at $2.28, which is the dividing line between further declines and a possible recovery.