

Ethereum price entered March after a tough February that resulted in losses of nearly 20%. ETH is currently in the red for six consecutive months since September 2025, an unprecedented streak in the token’s history. If March ends in the red, that period would be extended to seven months, further cementing what remains the longest sustained decline in Ethereum history.
Historically, the median return for ETH in March has been close to 9%, but the current setup suggests that history may provide little guidance. Here’s what the data shows:
The weekly chart has already collapsed
Even February 2025, which saw a 32% decline, quickly saw an attempt at recovery in the months that followed. The selling has been relentless this time, and the weekly chart explains why. Six consecutive months in the red, excluding March (when it was just formed), is no mean feat.
Want more token insights like this? Sign up for Editor Harsh Notariya’s Daily Crypto Newsletter here.
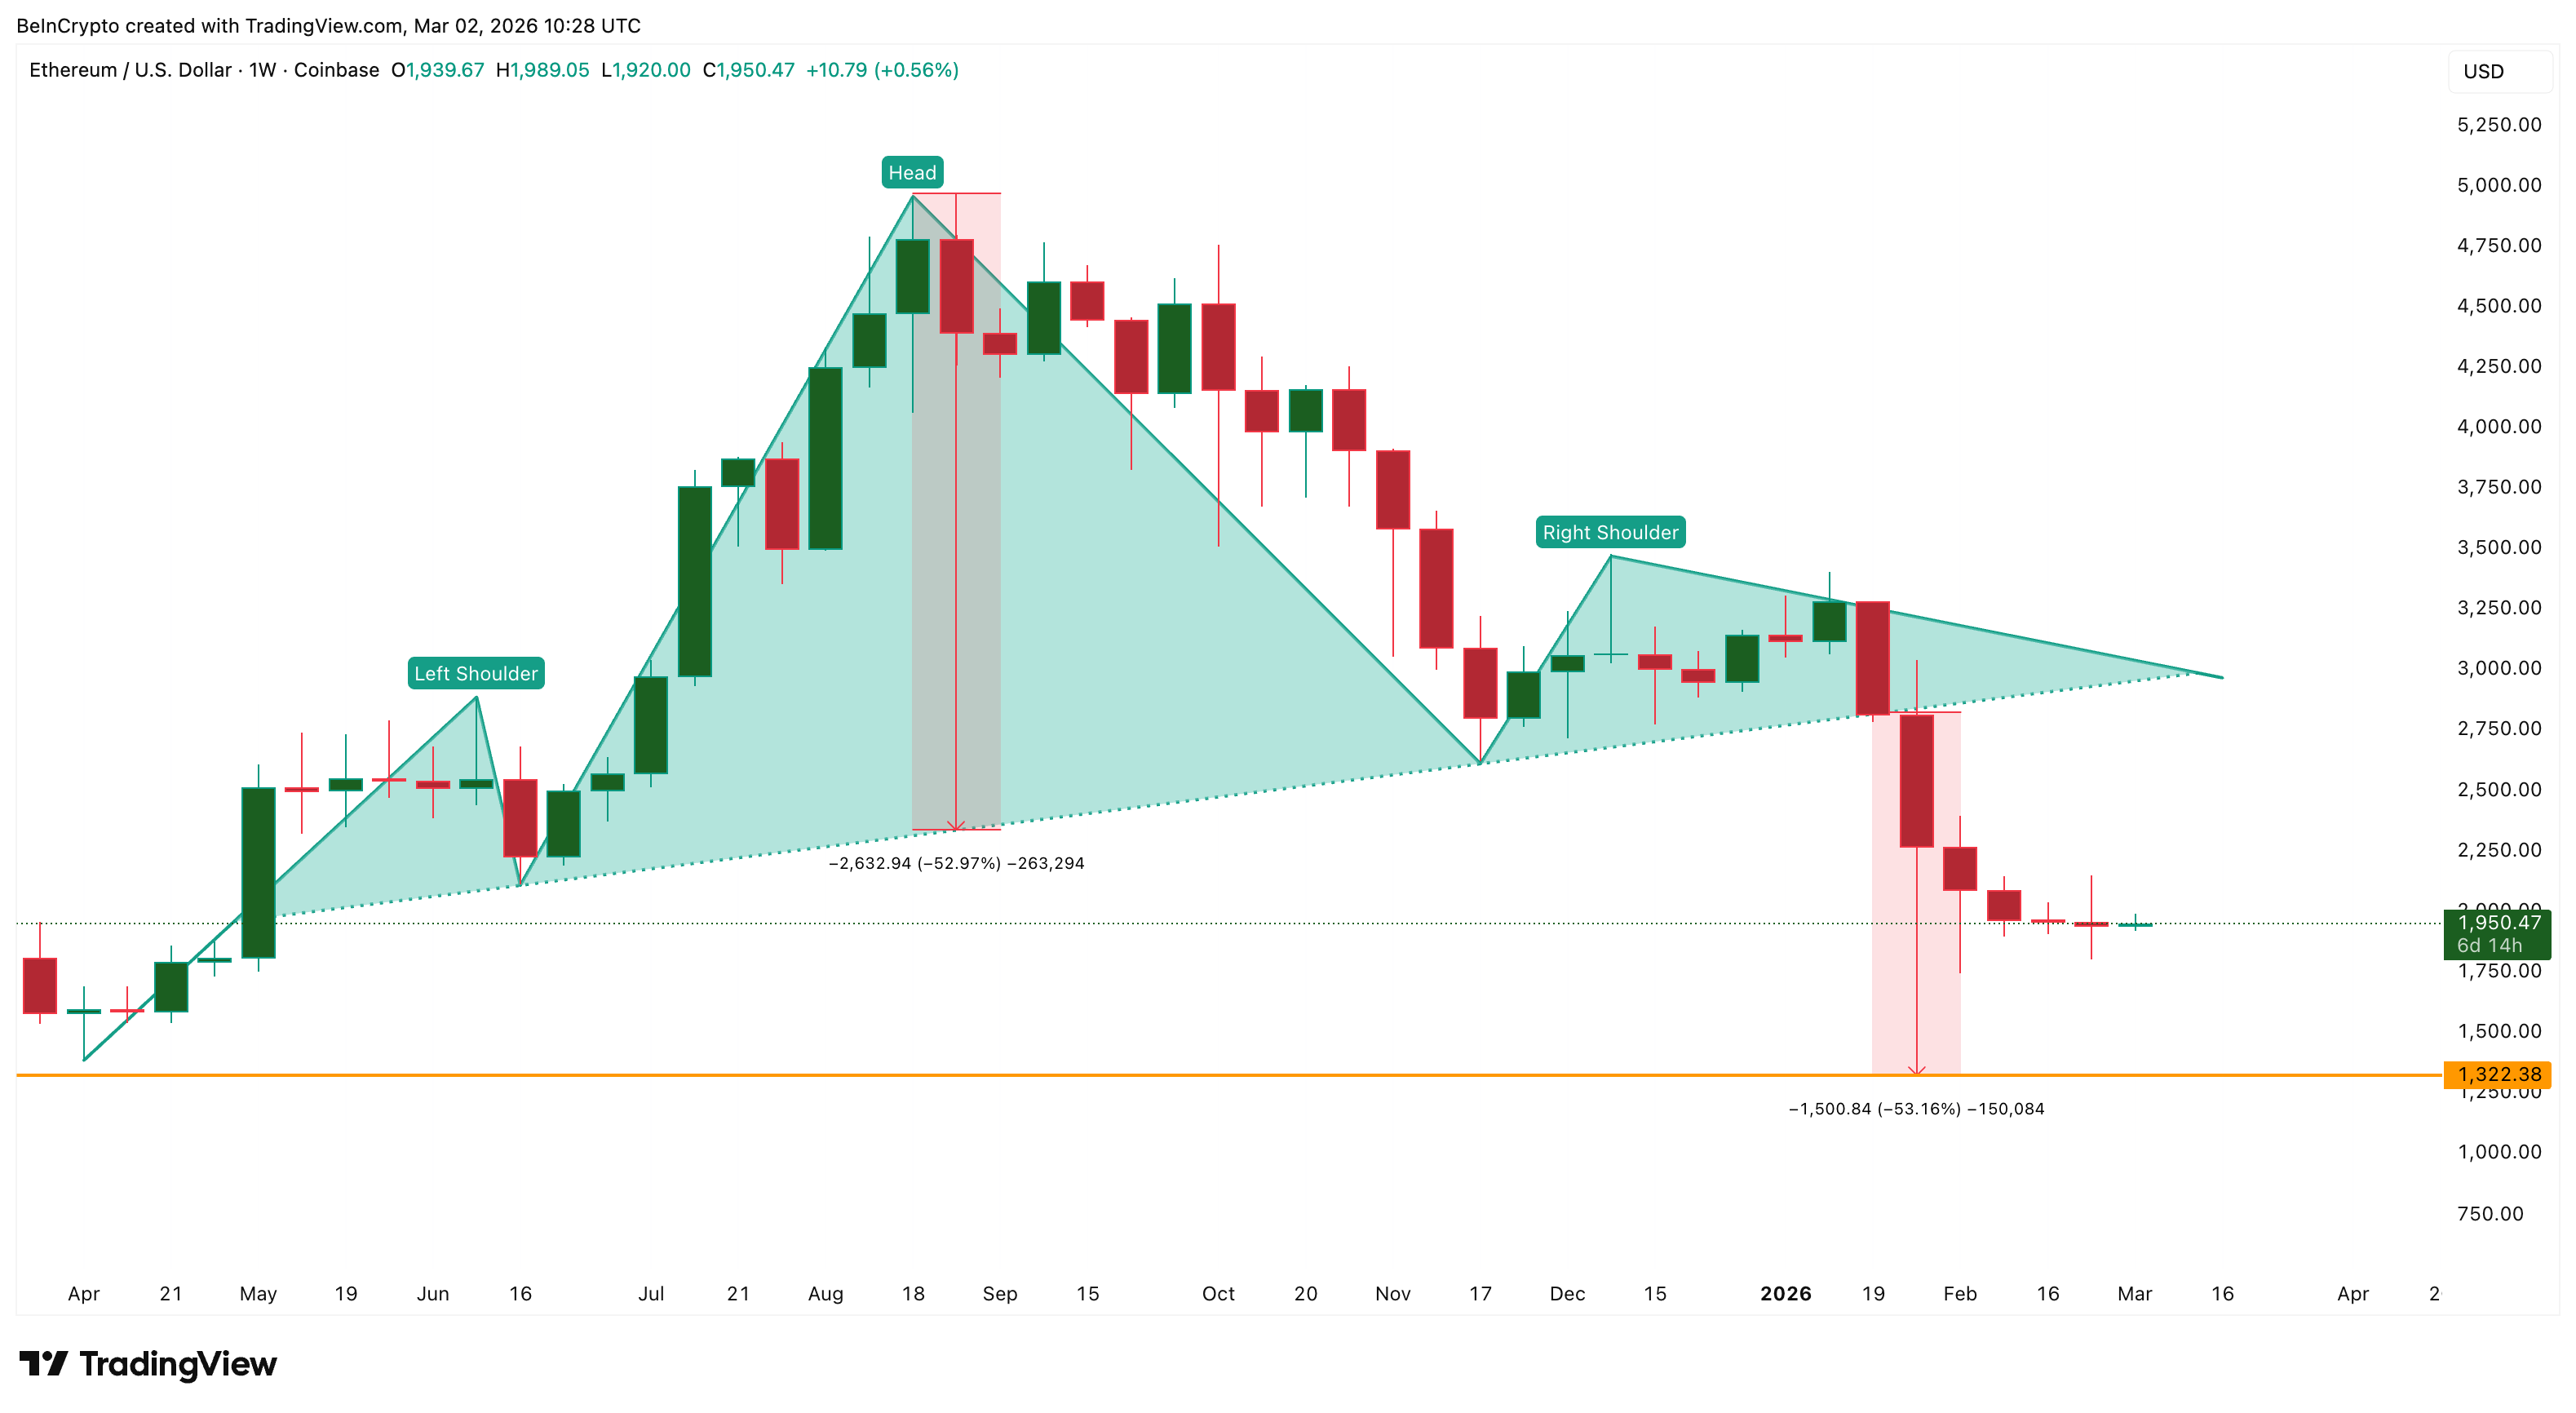
Since April 7, 2025, Ethereum price has been trading within a head and shoulders pattern. This is a bearish reversal structure with two lower peaks (shoulders) on either side of a central peak (head). This breakdown was confirmed in early January 2026, and was not a small drop. It was a structural failure.
A measured move from this pattern predicts a decline of approximately 53% from the breakdown line targeting approximately $1,320. We haven’t reached that level yet, but the pattern remains active and unresolved.
To make matters worse, two more bearish crossovers have formed at the weekly exponential moving average (EMA), which smooths price data and emphasizes trend direction.
The 50 period EMA is close to the 100 period EMA and the 20 period EMA is close to the 200 period EMA. The last seen crossover (when the 20 EMA fell below the 50 EMA in early January) preceded a 46% correction.
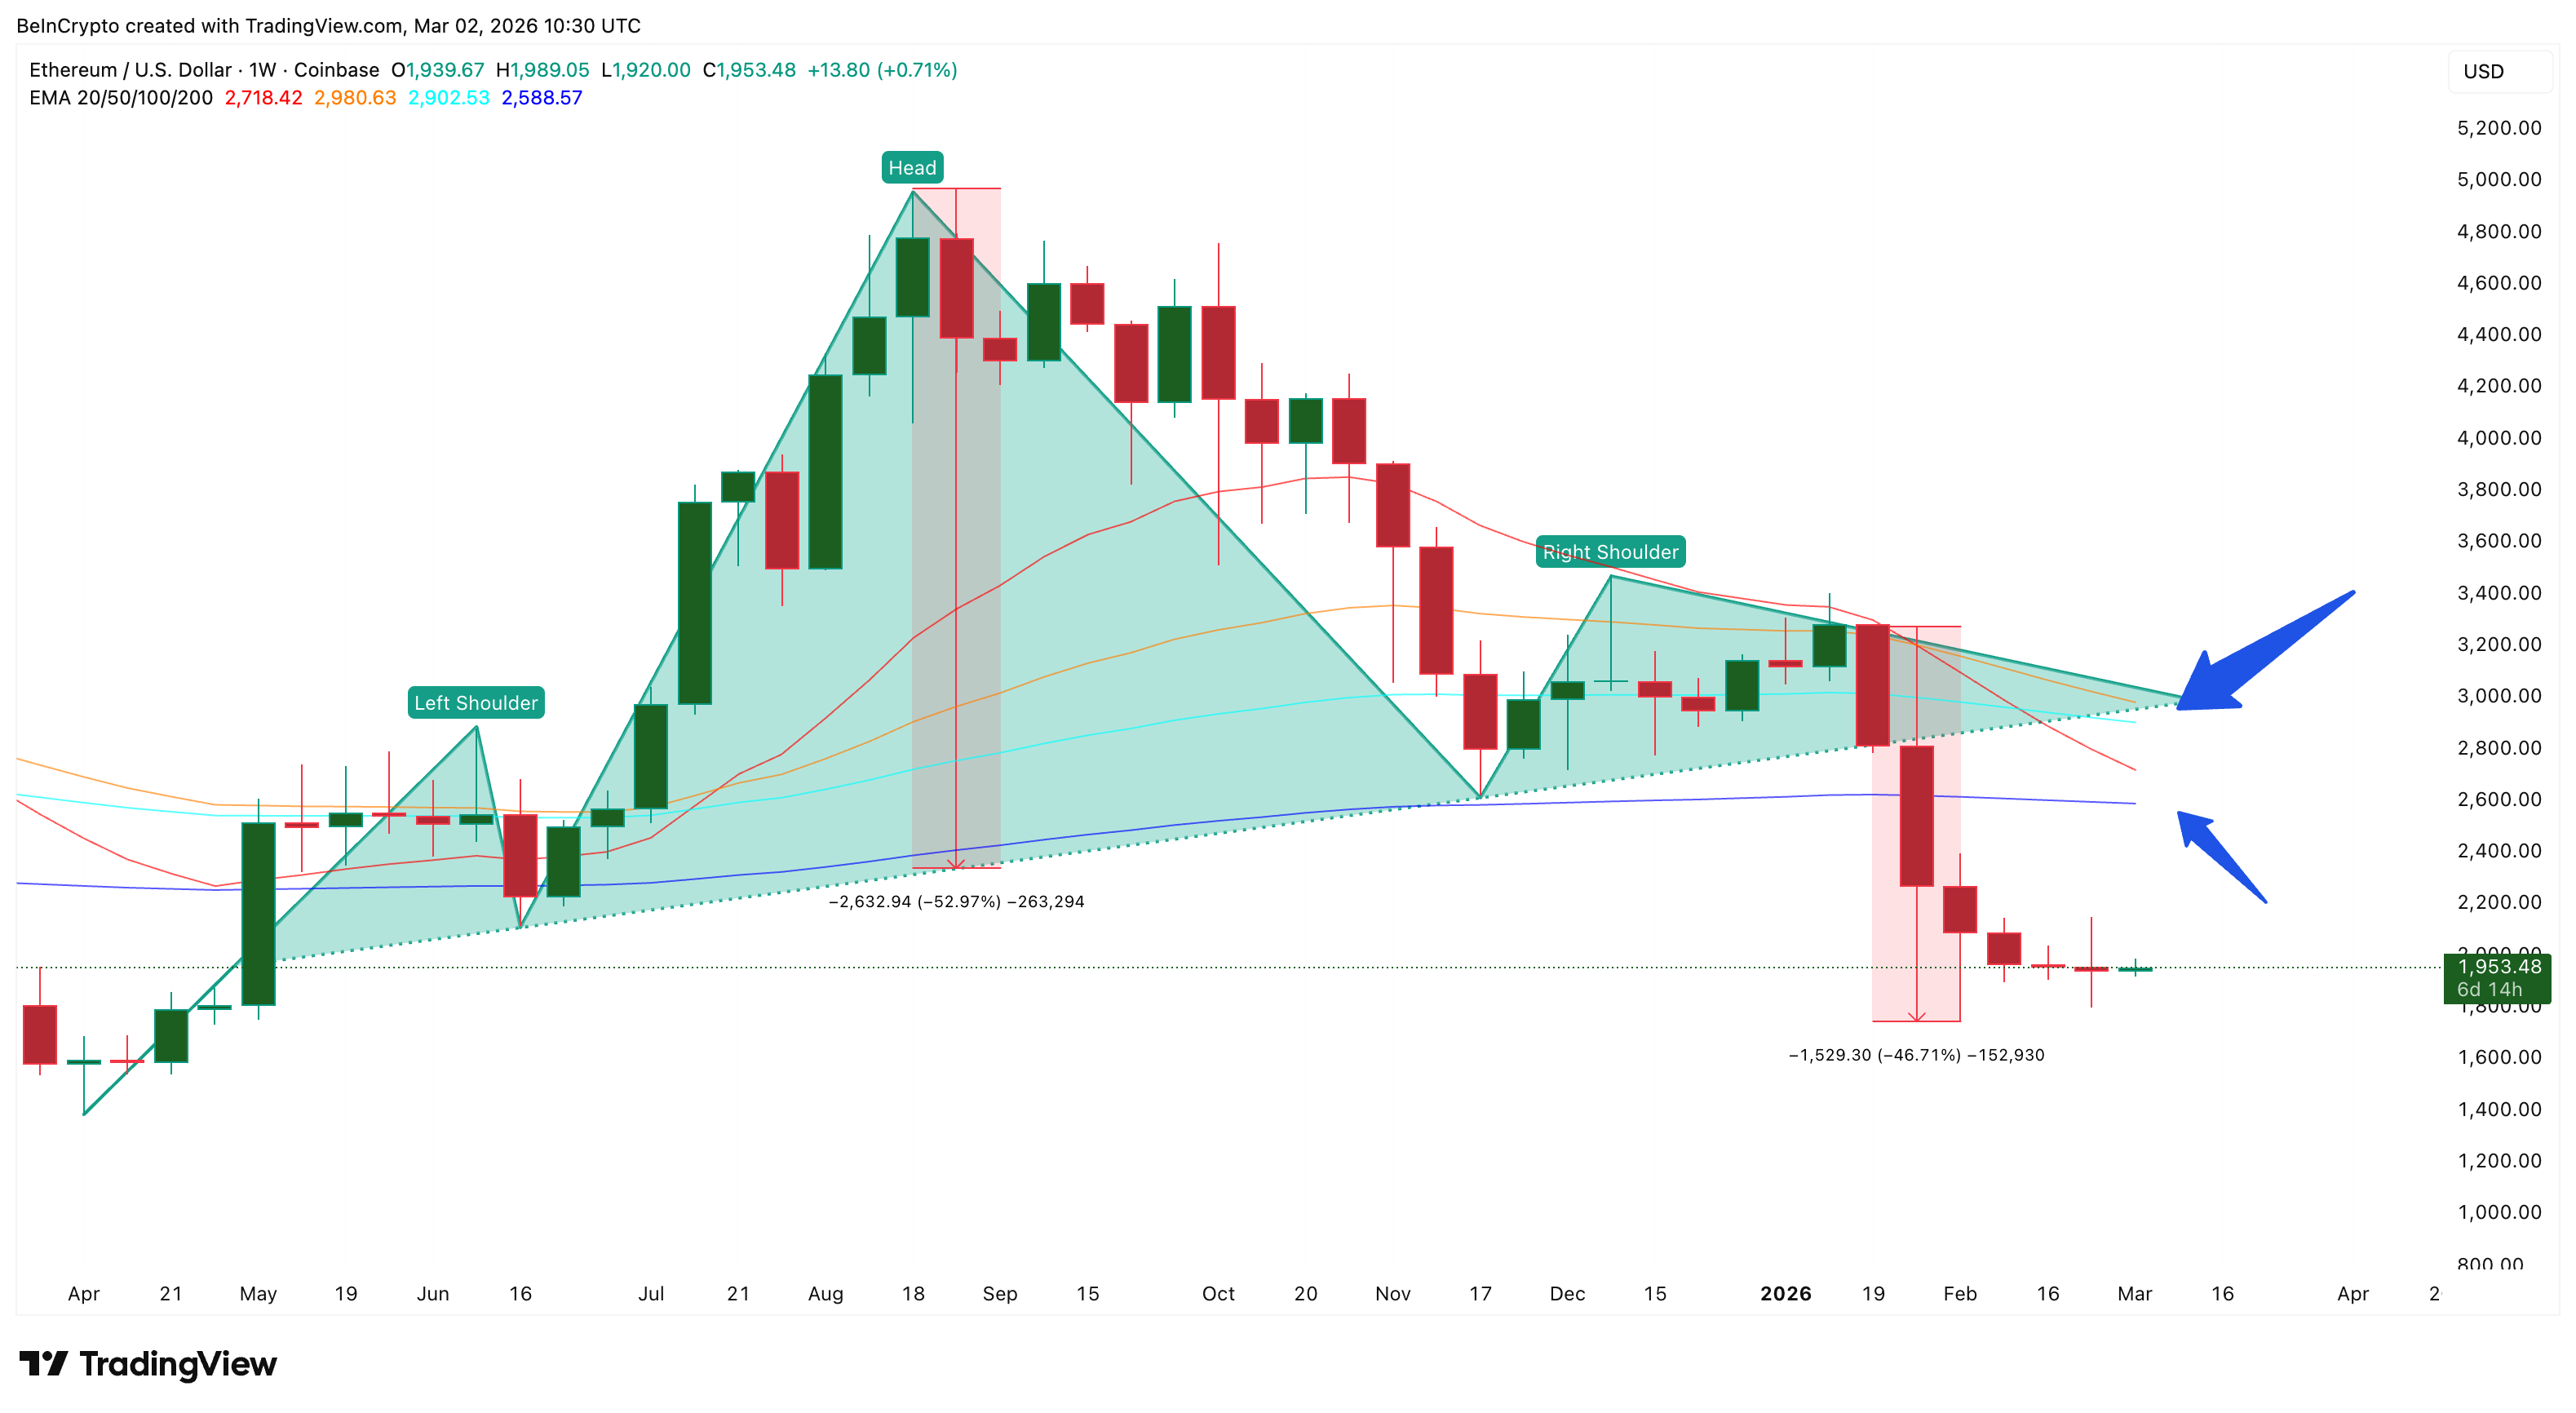
If these new crossovers are confirmed, they will strengthen the bearish trend on the higher time frames.
There is no institutional basis for the outflow of Ethereum ETFs
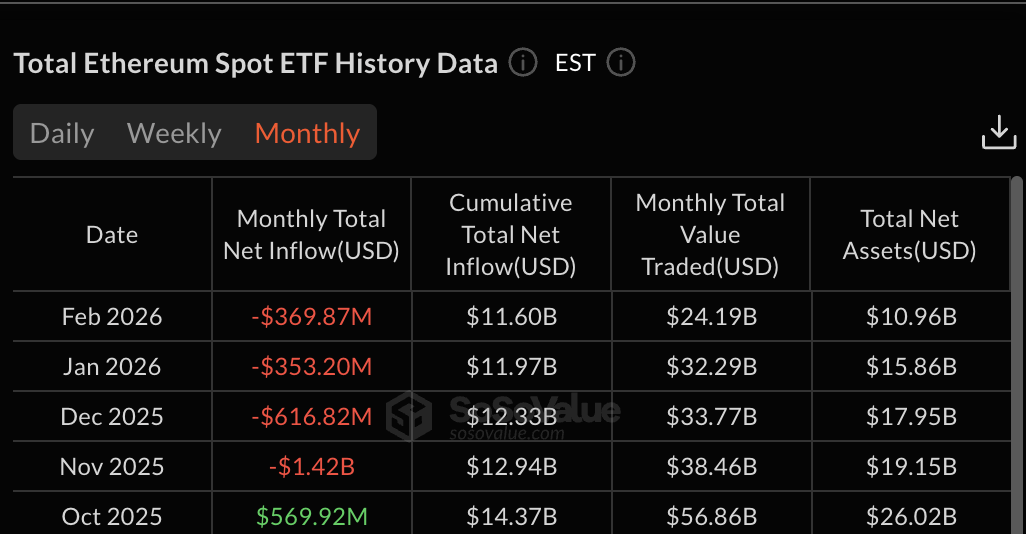
Unlike Bitcoin, where spot ETF outflows are steadily decreasing, the Ethereum ETF situation is worsening. In February, net outflows were recorded at $369.87 million, exceeding January’s $353.2 million. This reversed an improving trend that briefly offered hope when January’s outflows shrank compared to December’s $616.82 million.
This is the fourth consecutive month of outflows since November 2025, when $1.42 billion was outflowed. The last month with positive inflows was in October 2025 with $569.92 million.
In the case of Ethereum price, this means that the floor of institutional demand will not form heading into March. The capital that once supported ETH through ETF channels has been withdrawn, and unlike Bitcoin, the bleeding continues.
Hodler is making acquisitions, but the conspiracy thickens
Against this bearish backdrop, one on-chain indicator stands out. Ethereum hodlers (wallets that have held ETH for more than 155 days) are seeing a surge in purchases. On February 21st, Hodler’s net position change indicator was a modest +6,829 ETH. By March 1st, it had soared to +252,142 ETH, a massive 3,500% spike that on the surface looks like a strong conviction.
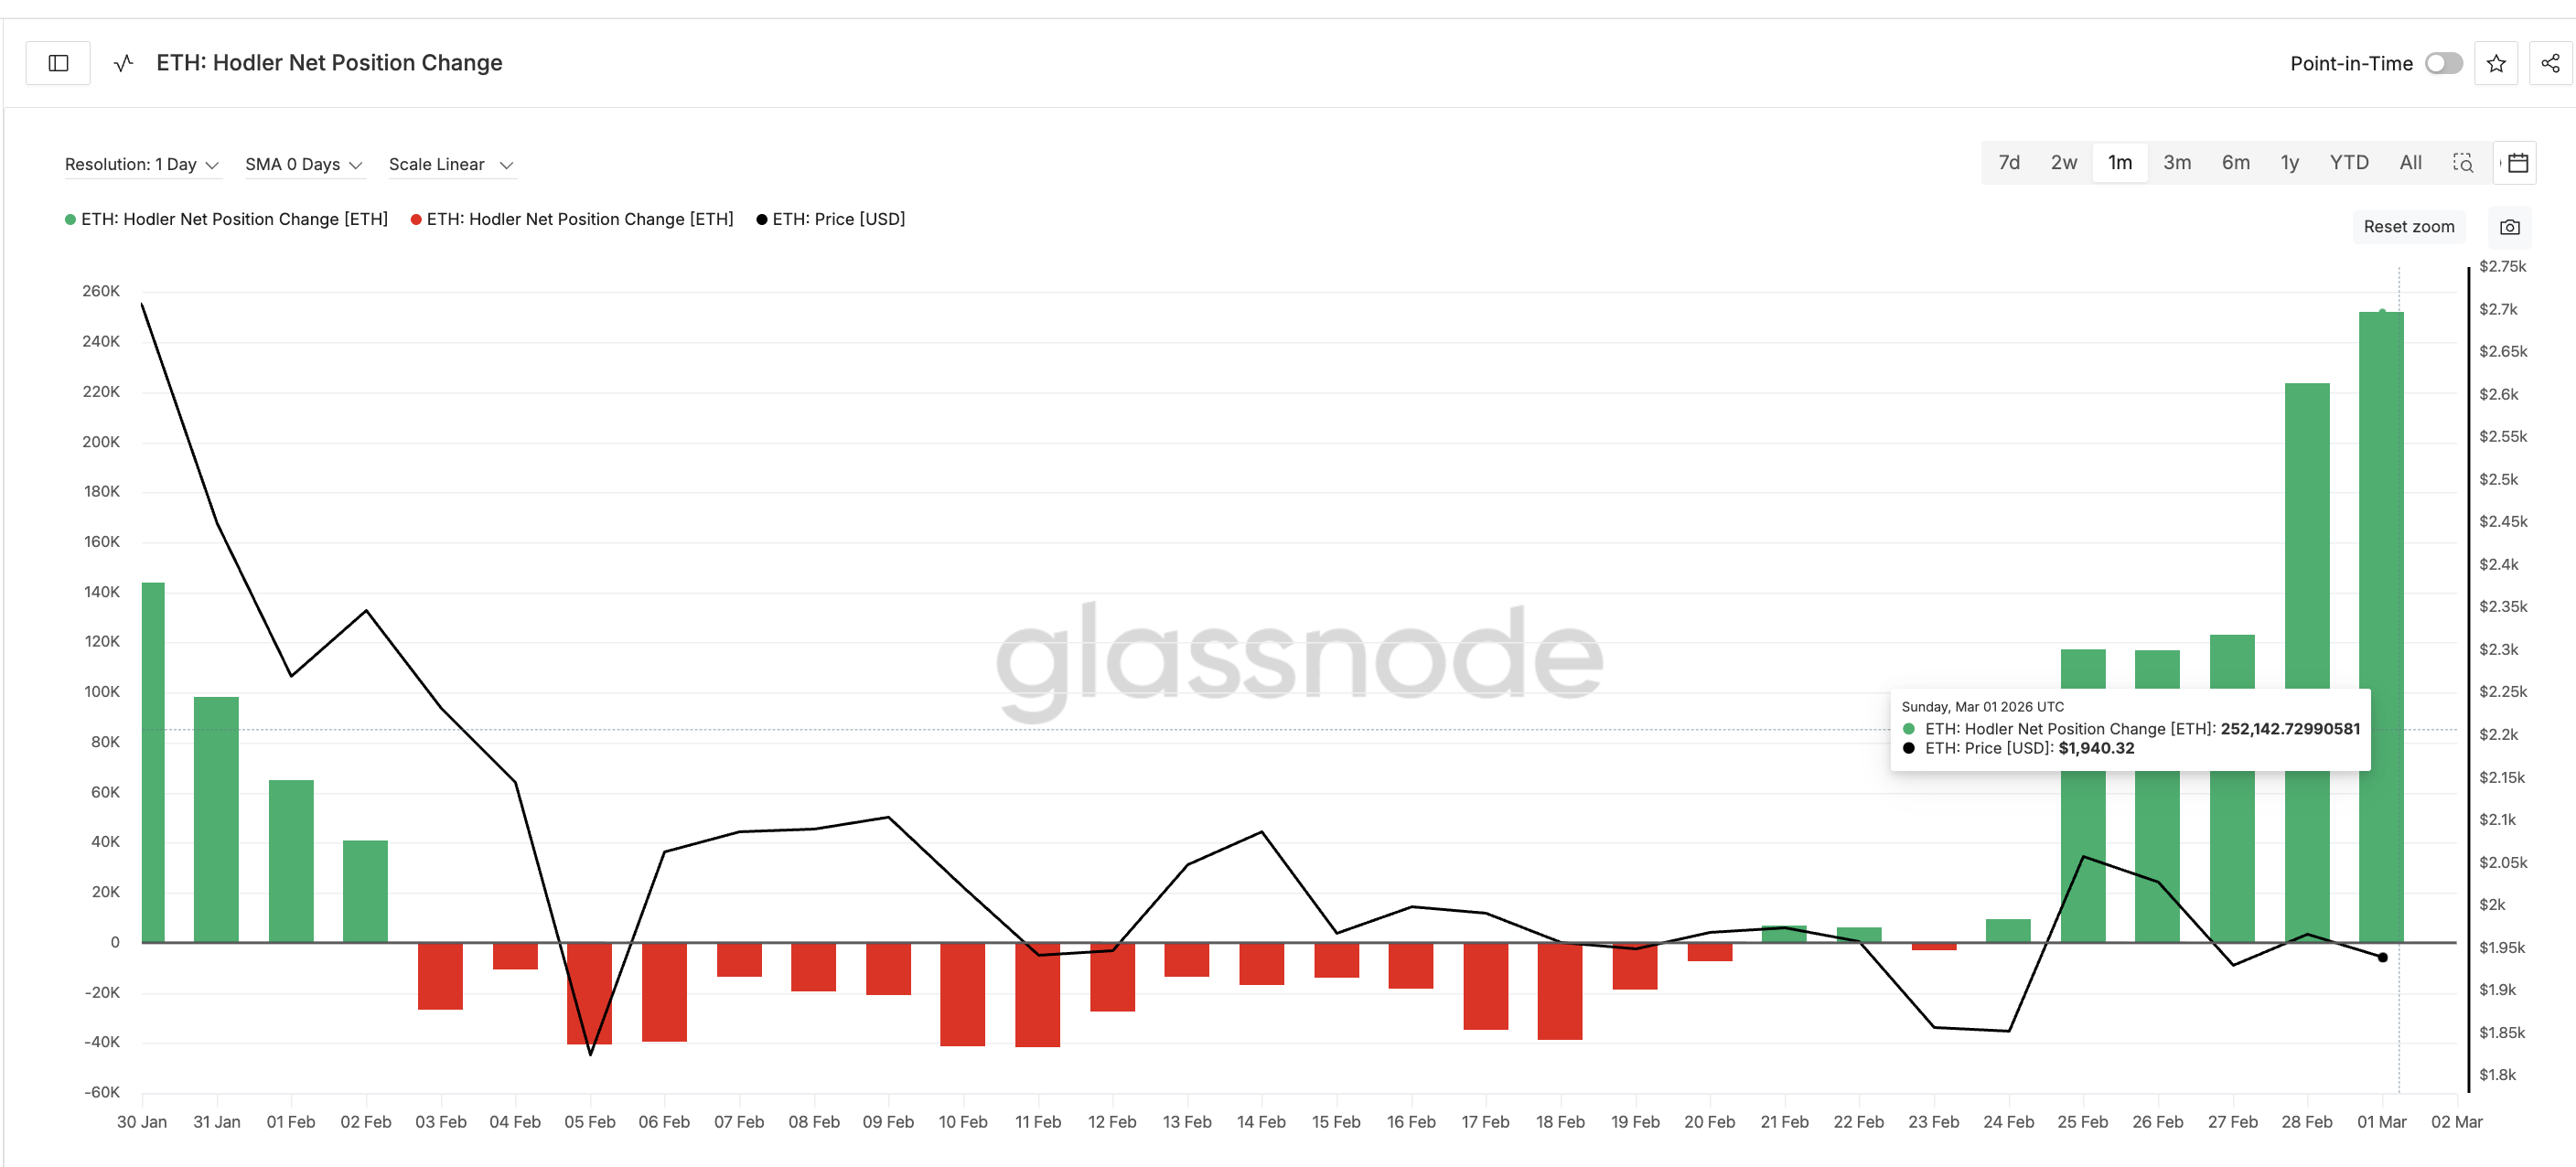
But context complicates this signal. The last major Hodler buying spell began on December 26, 2025, when Ethereum price was around $2,920. Prices rose to $3,350 by January 14th and they continued to accumulate. Then the weekly EMA crossover was triggered and the price started to fall sharply. Mr. Hodlers continued to buy even during the downturn. Their net position became negative on February 2nd, when the price had already fallen to $2,340.
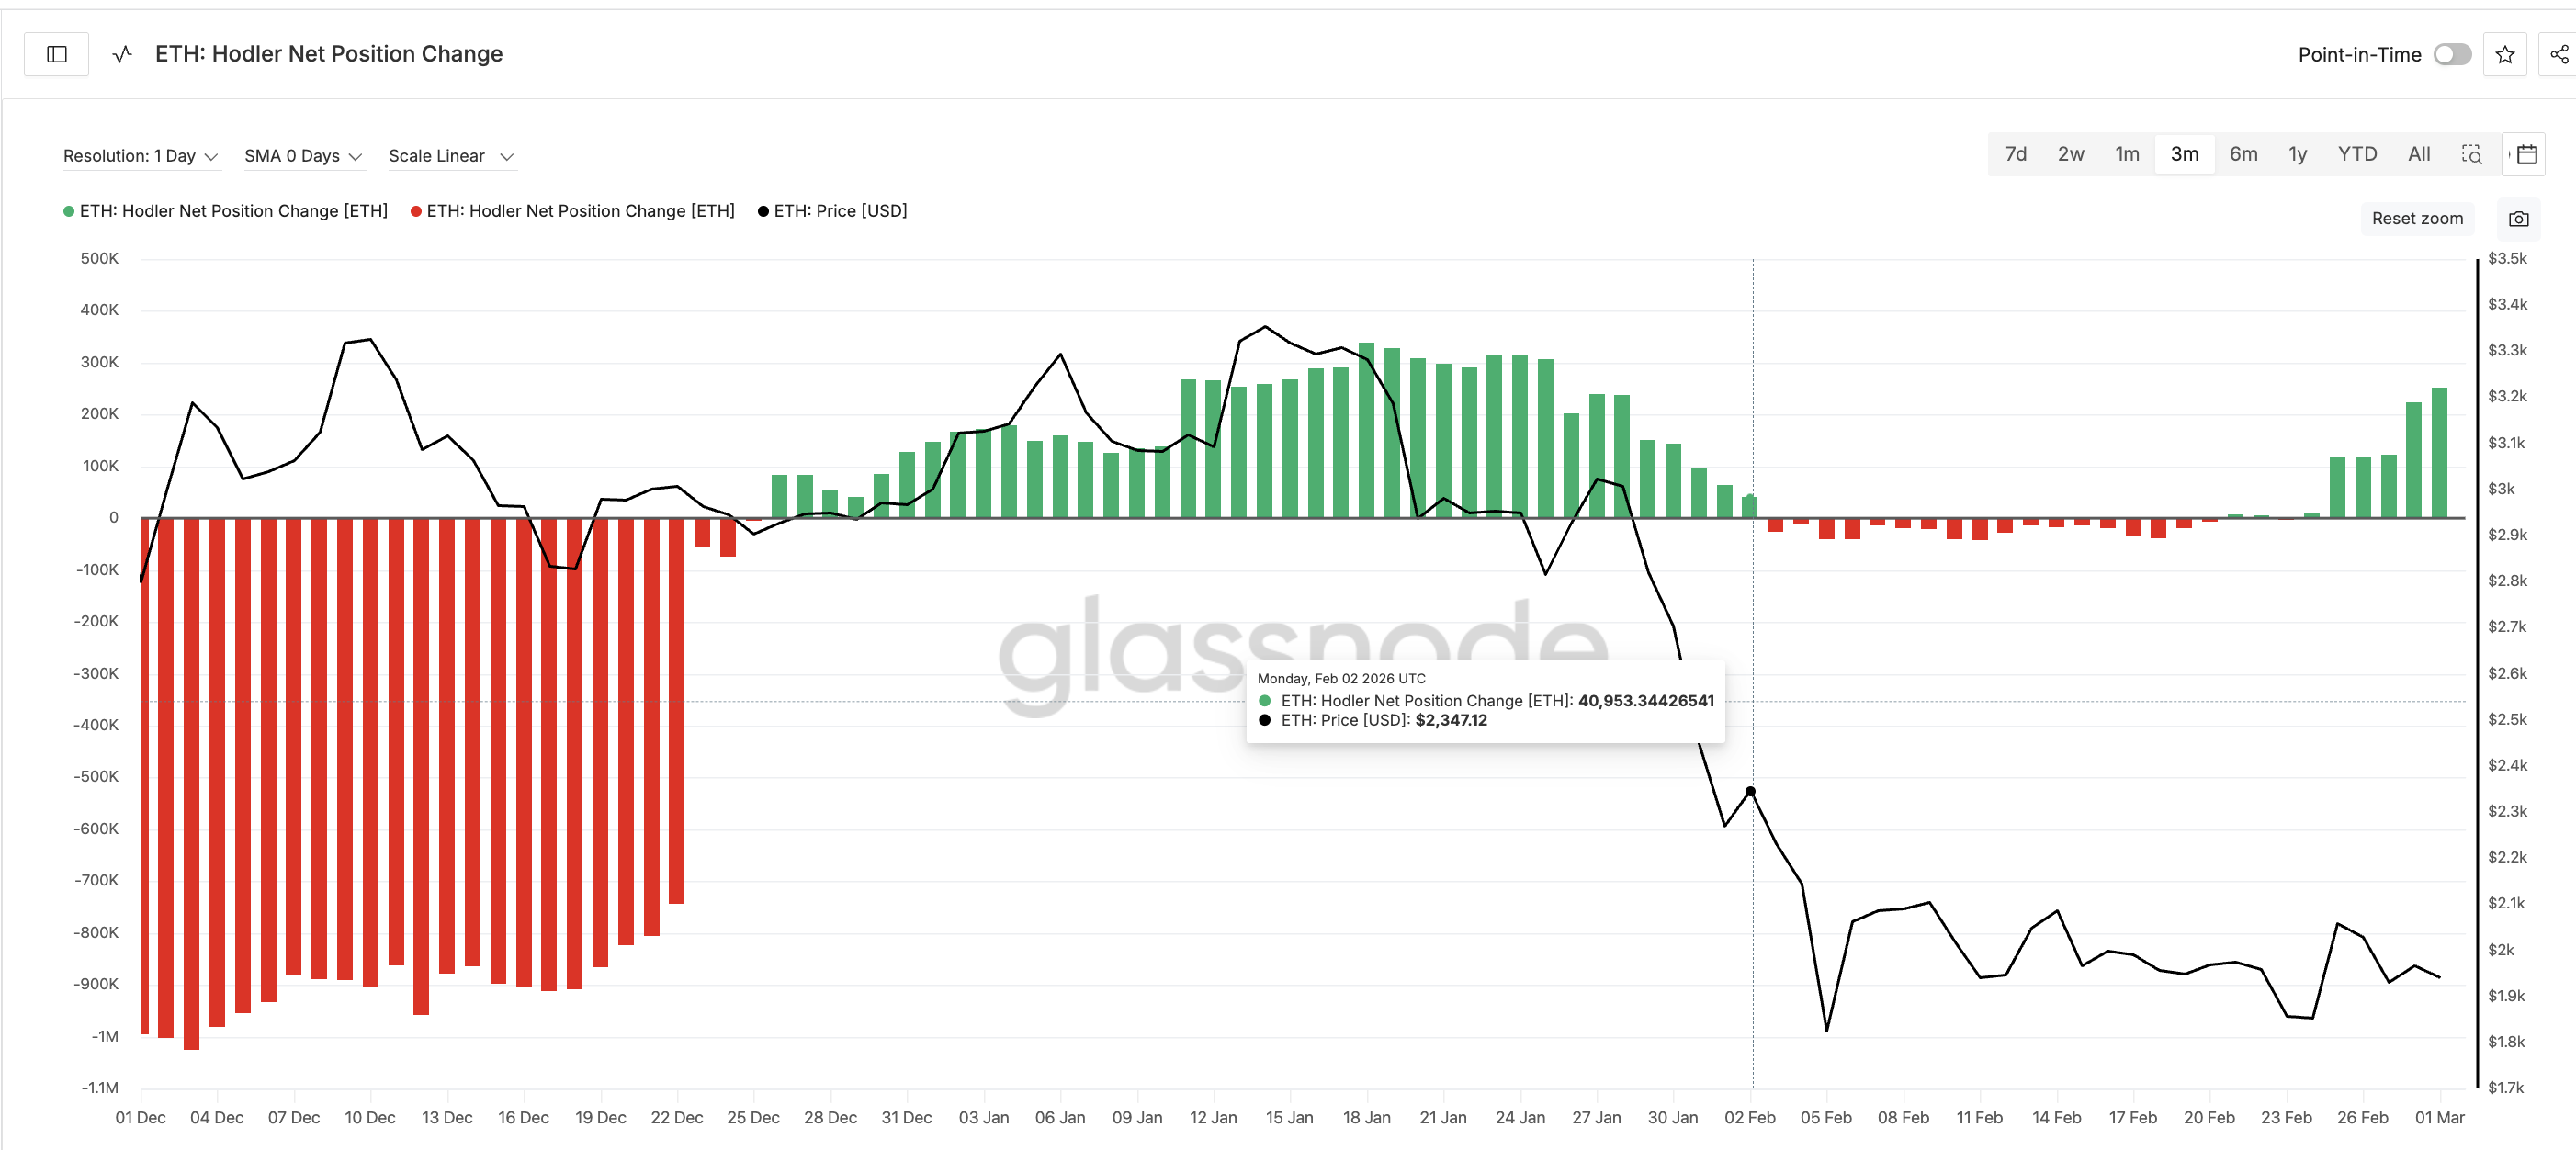
So many of these hodlers could be trapped between $2,340 and $3,350. The current surge in buying may not represent new bullish conviction, but rather an attempt to drive the average down to breakeven. Retail investors should be wary of blindly following this signal. The motivation behind the purchase may be survival rather than strategy.
But there’s a reason they buy it. And the key Ethereum price levels to watch
If hodlers are trapped, why are they increasing their exposure now in a weak market? The 12-hour chart may hold the answer.
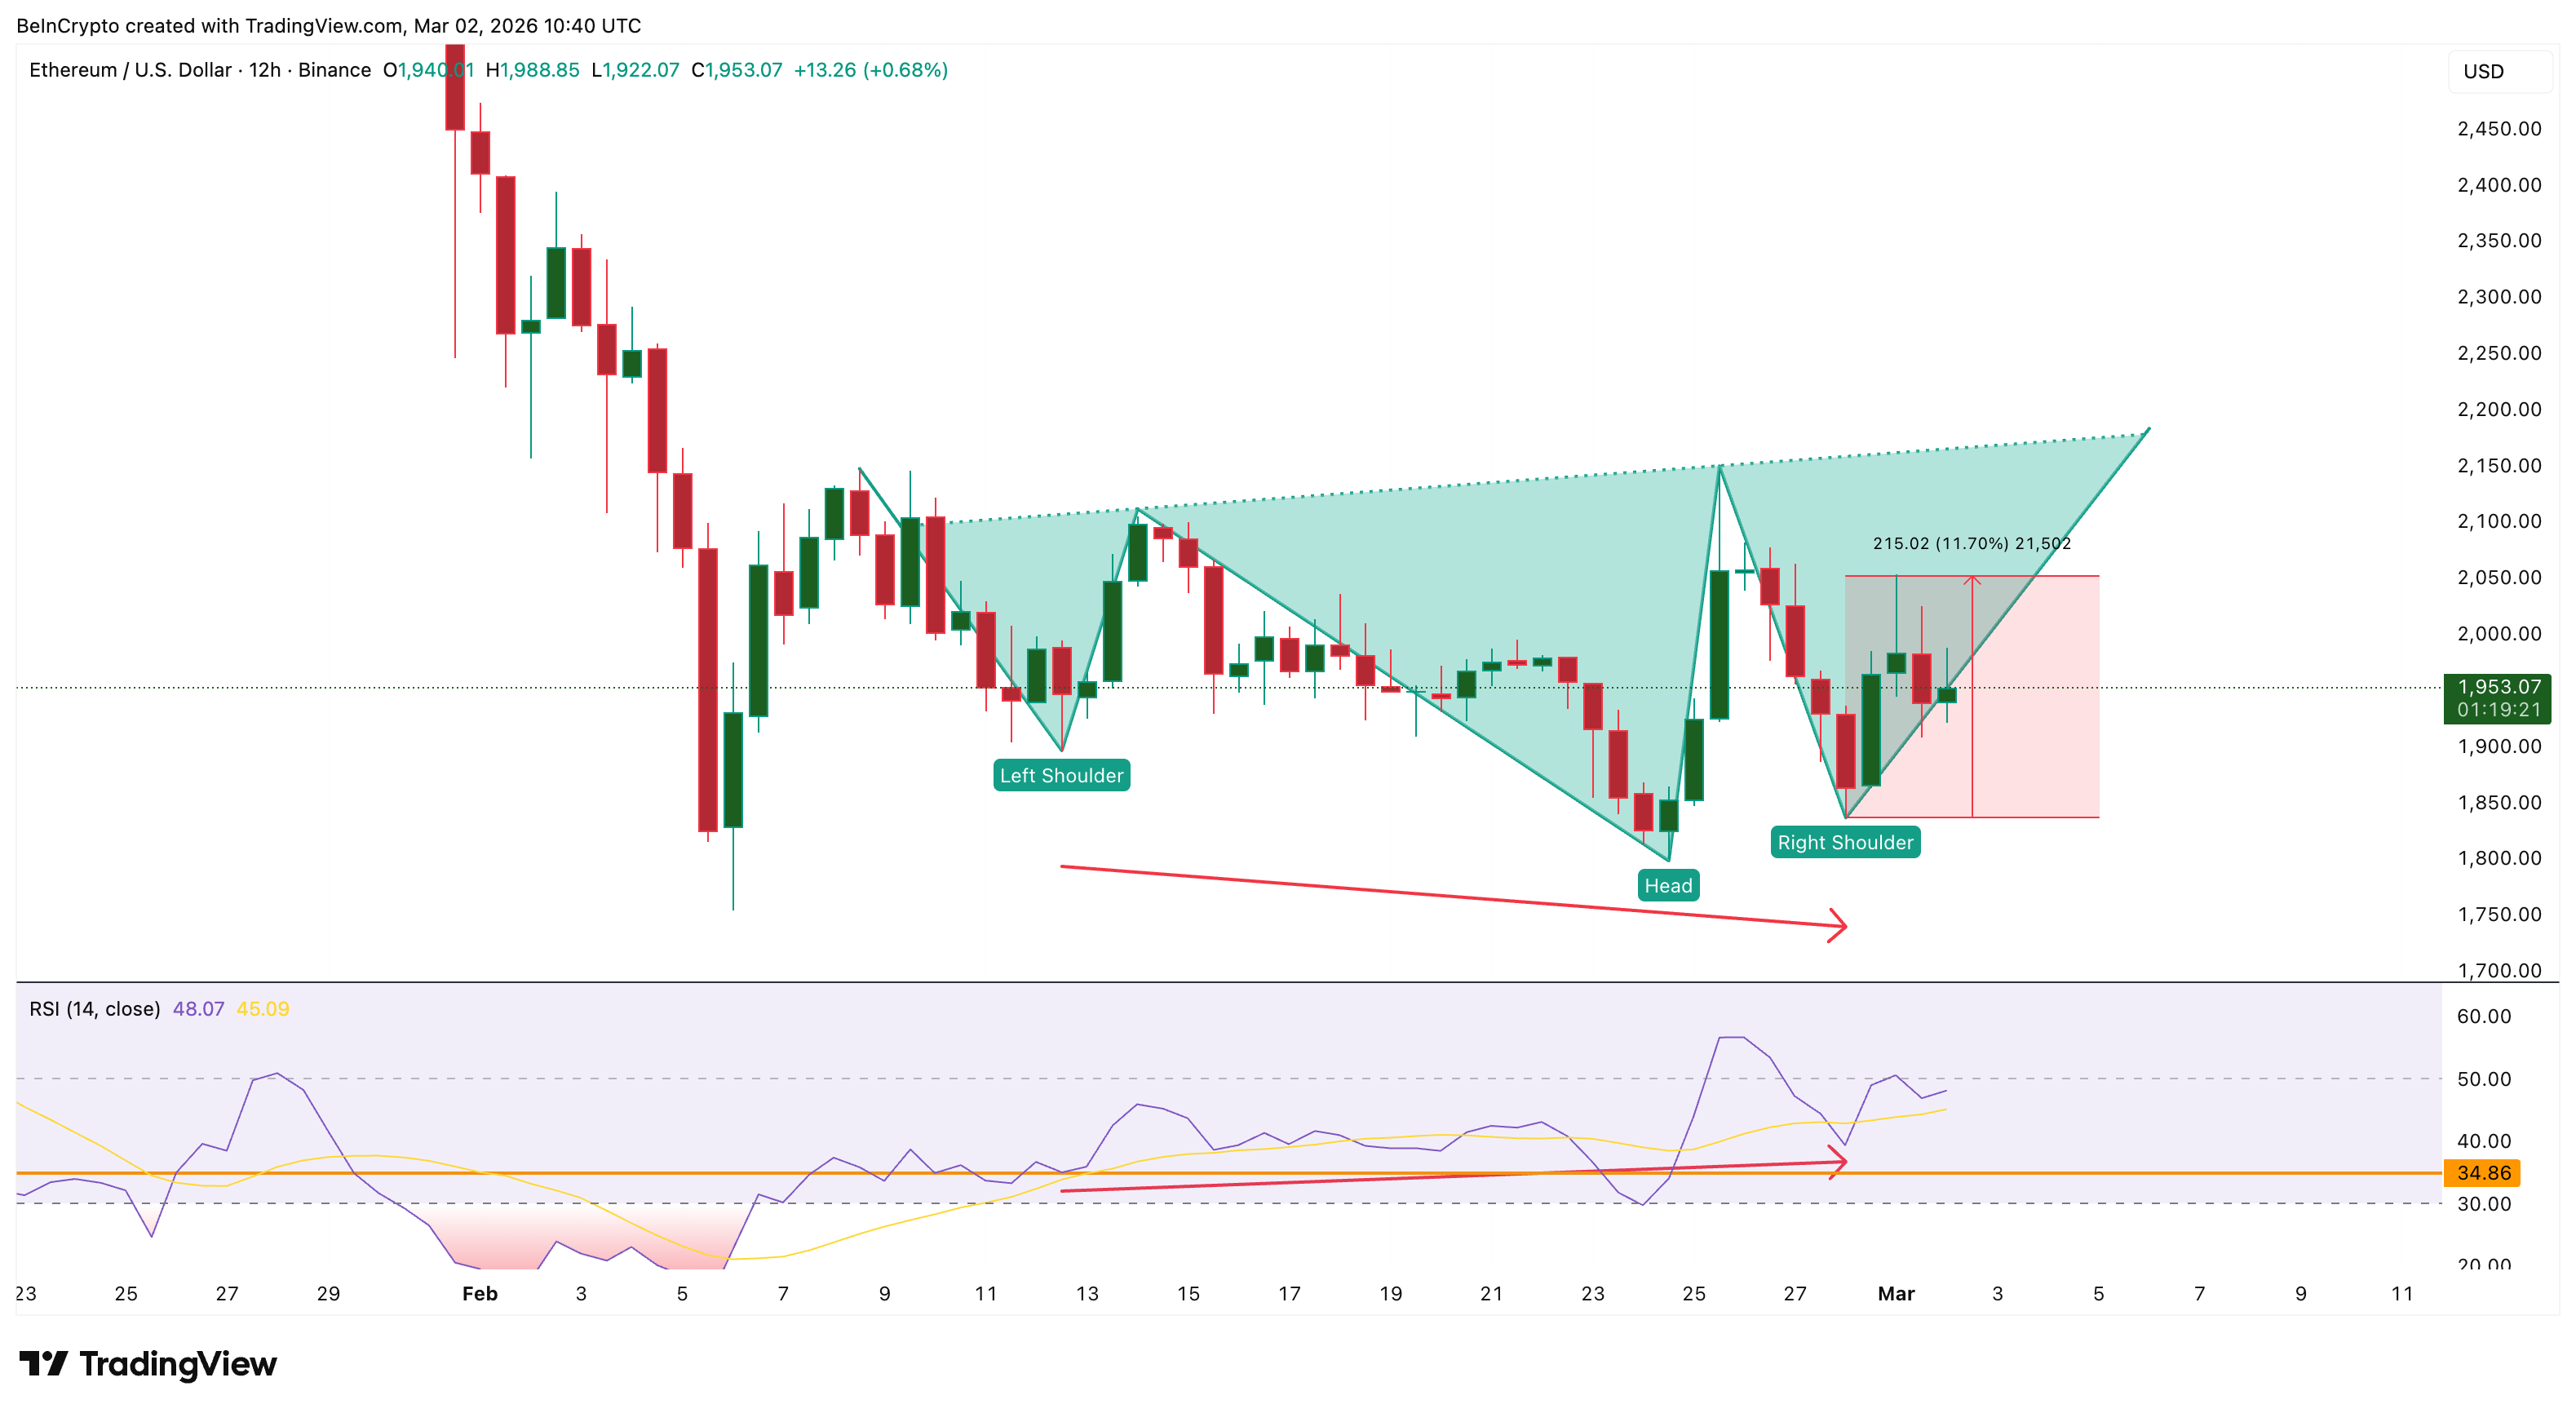
From February 12th to February 28th, Ethereum price hit a low, but the relative strength index (RSI) (momentum oscillator) hit a higher low. This forms a bullish divergence, indicating that selling momentum is weakening even as prices fall. This divergence has already caused a rebound, with Ethereum price up about 11.7% from its lows.
More importantly, this pullback is forming an inverted head-and-shoulders pattern on the 12-hour chart. Bullish reversal structure. This is likely what Hodler is targeting, a short-term breakout that could help recover losses from the January trap. The technical setup is real and the RSI divergence has already been verified by the first bounce.
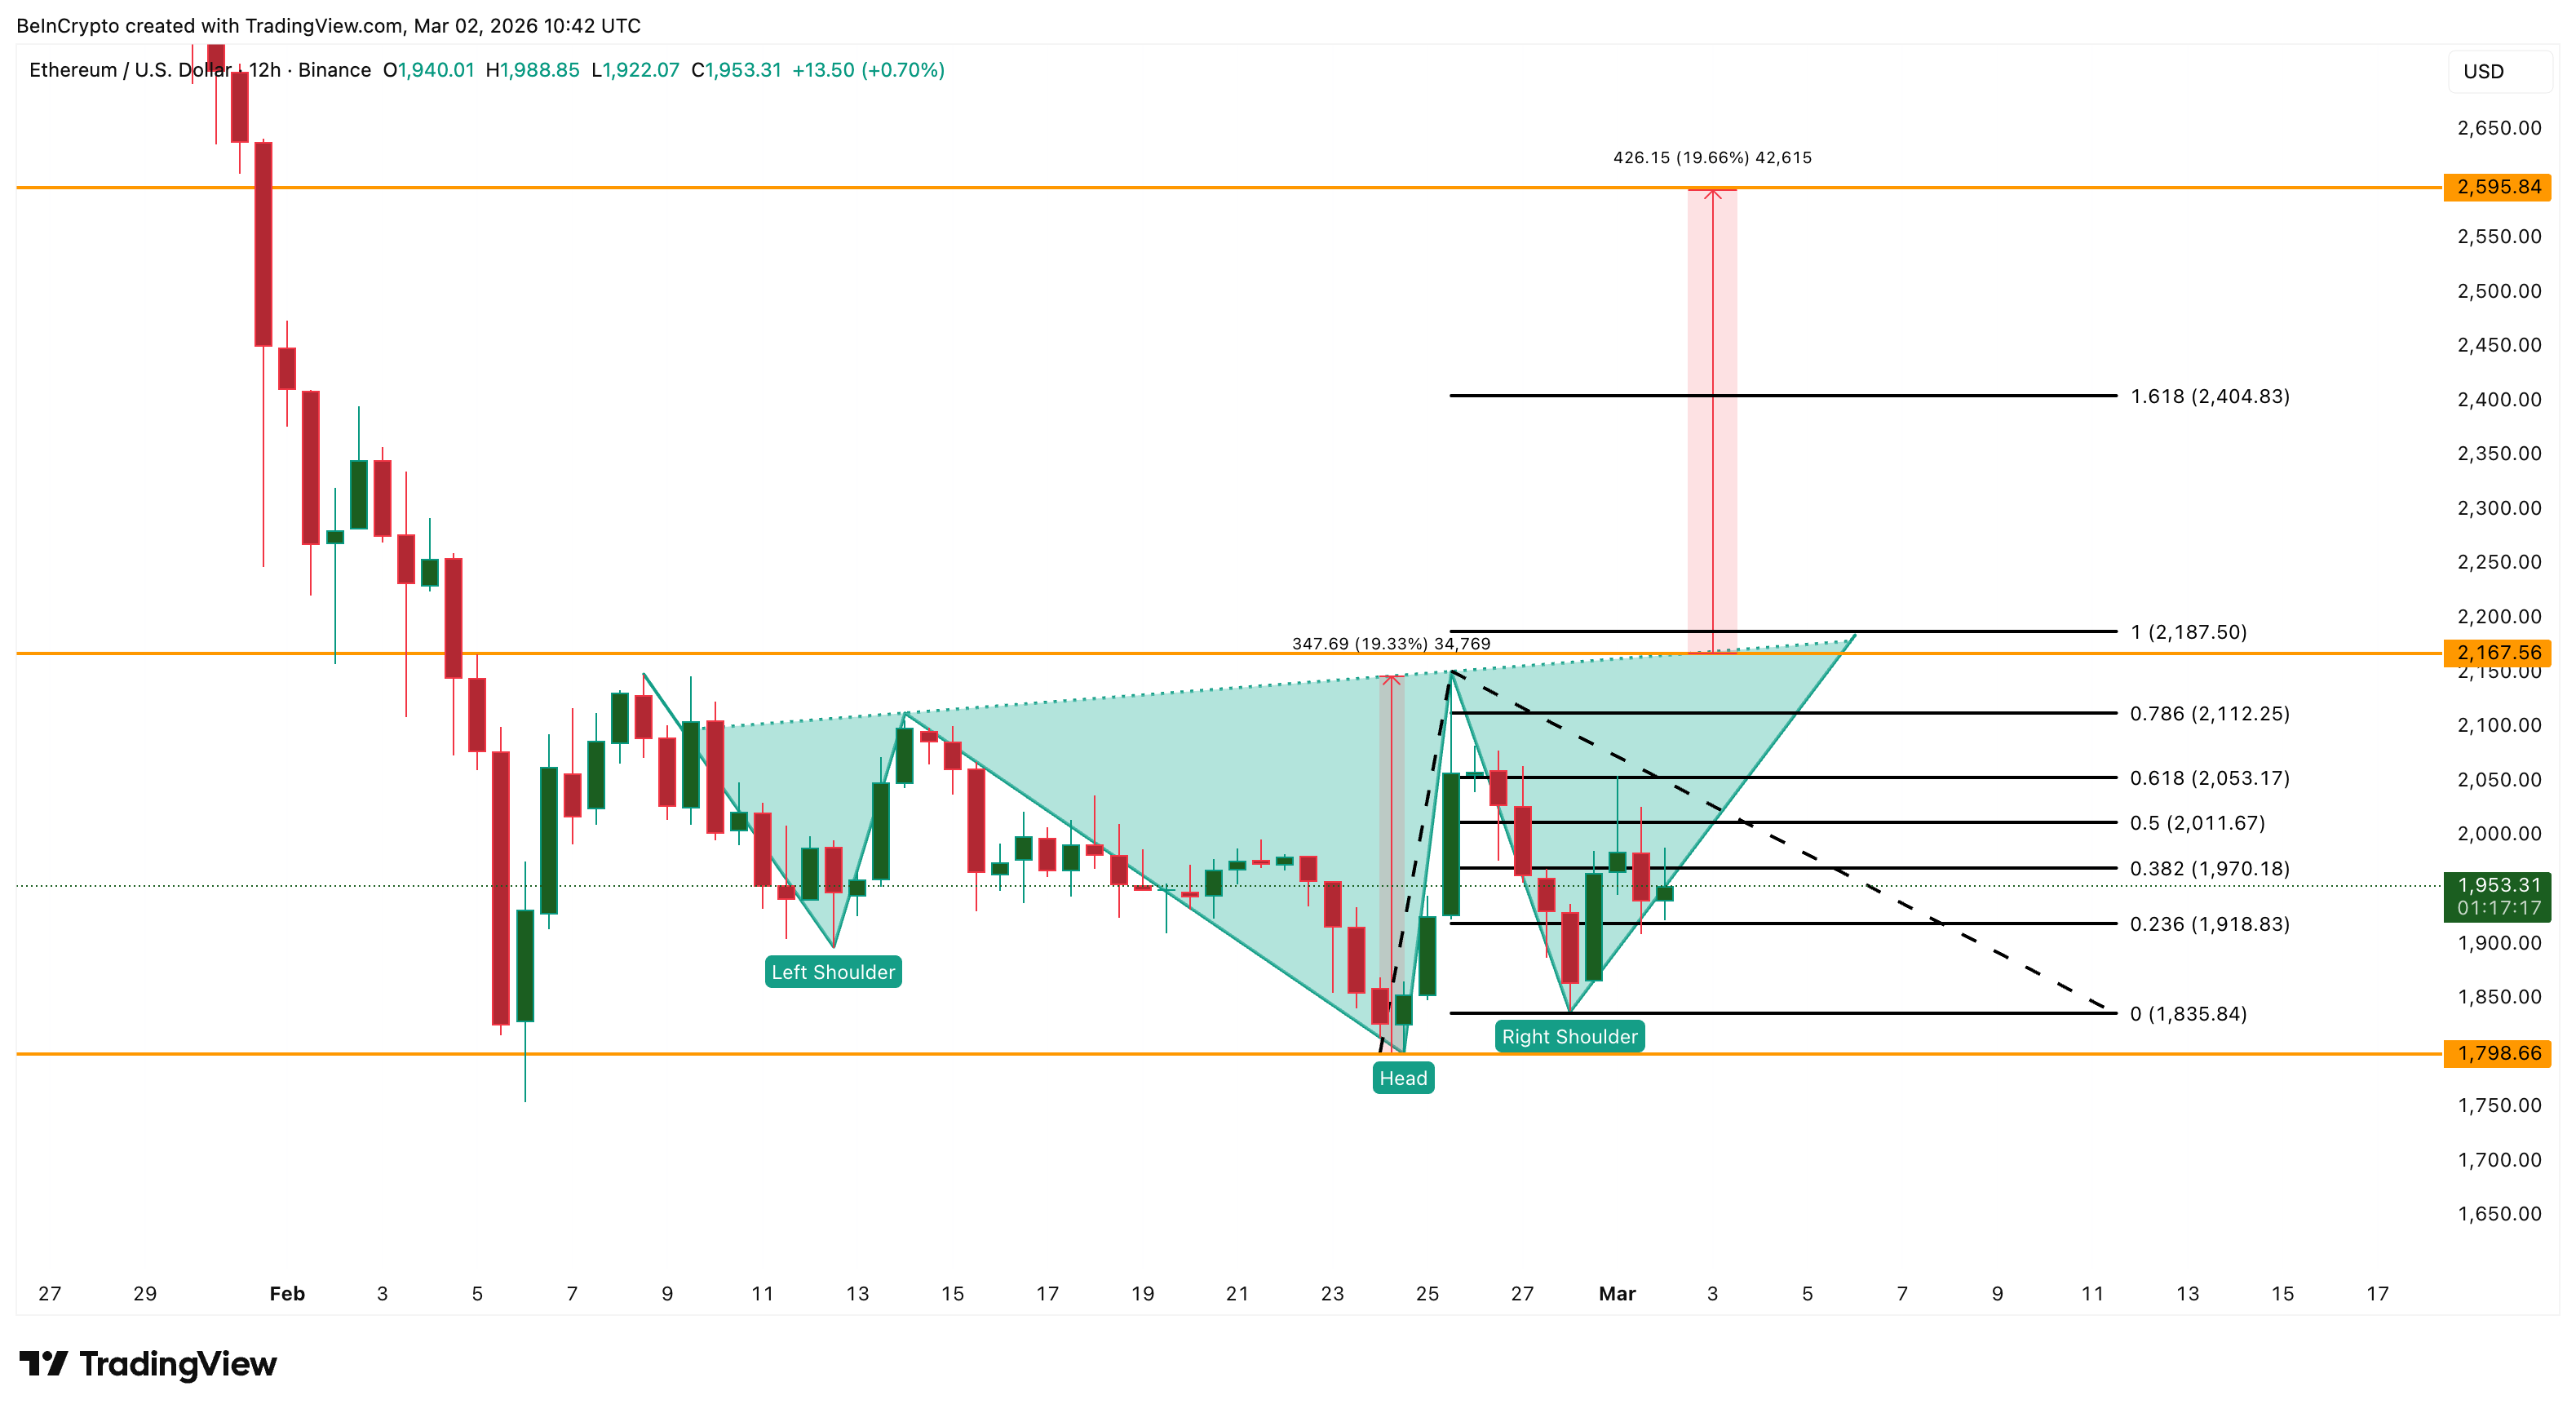
Necklines range from $2,160 to $2,180. If Ethereum price closes above this level, the measured move predicts an increase of around 19% with a target of around $2,590. Before that, the Fibonacci extension levels of $2,050 and $2,400 will act as intermediate resistance zones.
On the downside, a decline below $1,830 would weaken the head-and-shoulders. A close below $1,790 completely invalidates the pullback theory, reaffirms the weekly head-and-shoulders dominance and brings the $1,320 target back into focus.
The most likely path for March mirrors Bitcoin’s setup. Renewed pressure continues as the attempted rebound caused by the 12-hour structure and hodler accumulation and subsequent weekly trend remains bullish.
The recovery is real, but it is battling a far greater collapse.