

Strategy Inc. (MSTR) soared 6% on Monday as Bitcoin’s weekend rally finally made an impact on stock prices. But it’s already all back at $131 pre-market on Tuesday. At the time of writing, this represents an approximate 5% change from Monday’s closing price.
With weekly trading volume down 67% from February highs and volatility at 106%, MicroStrategy stock’s reduced liquidity could amplify what the technicals are already showing. And $124 is a dangerous level.
Bitcoin rebounds, but volume and volatility tell a different story
Bitcoin plummeted to $63,000 over the weekend following the conflict between the United States and Iran, but rebounded by Sunday night. Since MSTR is a stock, I couldn’t react until Monday. Therefore, Friday’s close near $129 compressed two days of Bitcoin price action into a single opening candlestick. The stock has gapped, rebounding more than 6% to yesterday’s close of around $137. However, Bitcoin fell overnight to $66,800, already wiping out those gains at $131 pre-market on Tuesday.
This is the pattern. Whatever Bitcoin does in the evening or over the weekend, MSTR is absorbed by the intense burst at market opening.
This compression increased the 30-day annualized volatility to 105.8%. This is the highest among major large-cap stocks in the U.S., higher than Bitcoin’s 67.5% and nearly double MSTR’s own annual average of 57.2%.
Higher volatility means more price swings in both directions, wider spreads, and greater risk of sudden liquidations, especially if there are fewer traders available to absorb the moves. This is all due to a decline in participants.
Average weekly trading value is now at $2.59 billion, down 67% from a peak of $7.8 billion in early February. The monthly average was $3.3 billion, down 58% from the same peak. Increasing volatility as volume collapses means there are fewer MicroStrategy shareholders contributing to larger swings, making movements less reliable and more susceptible to whiplash moves.
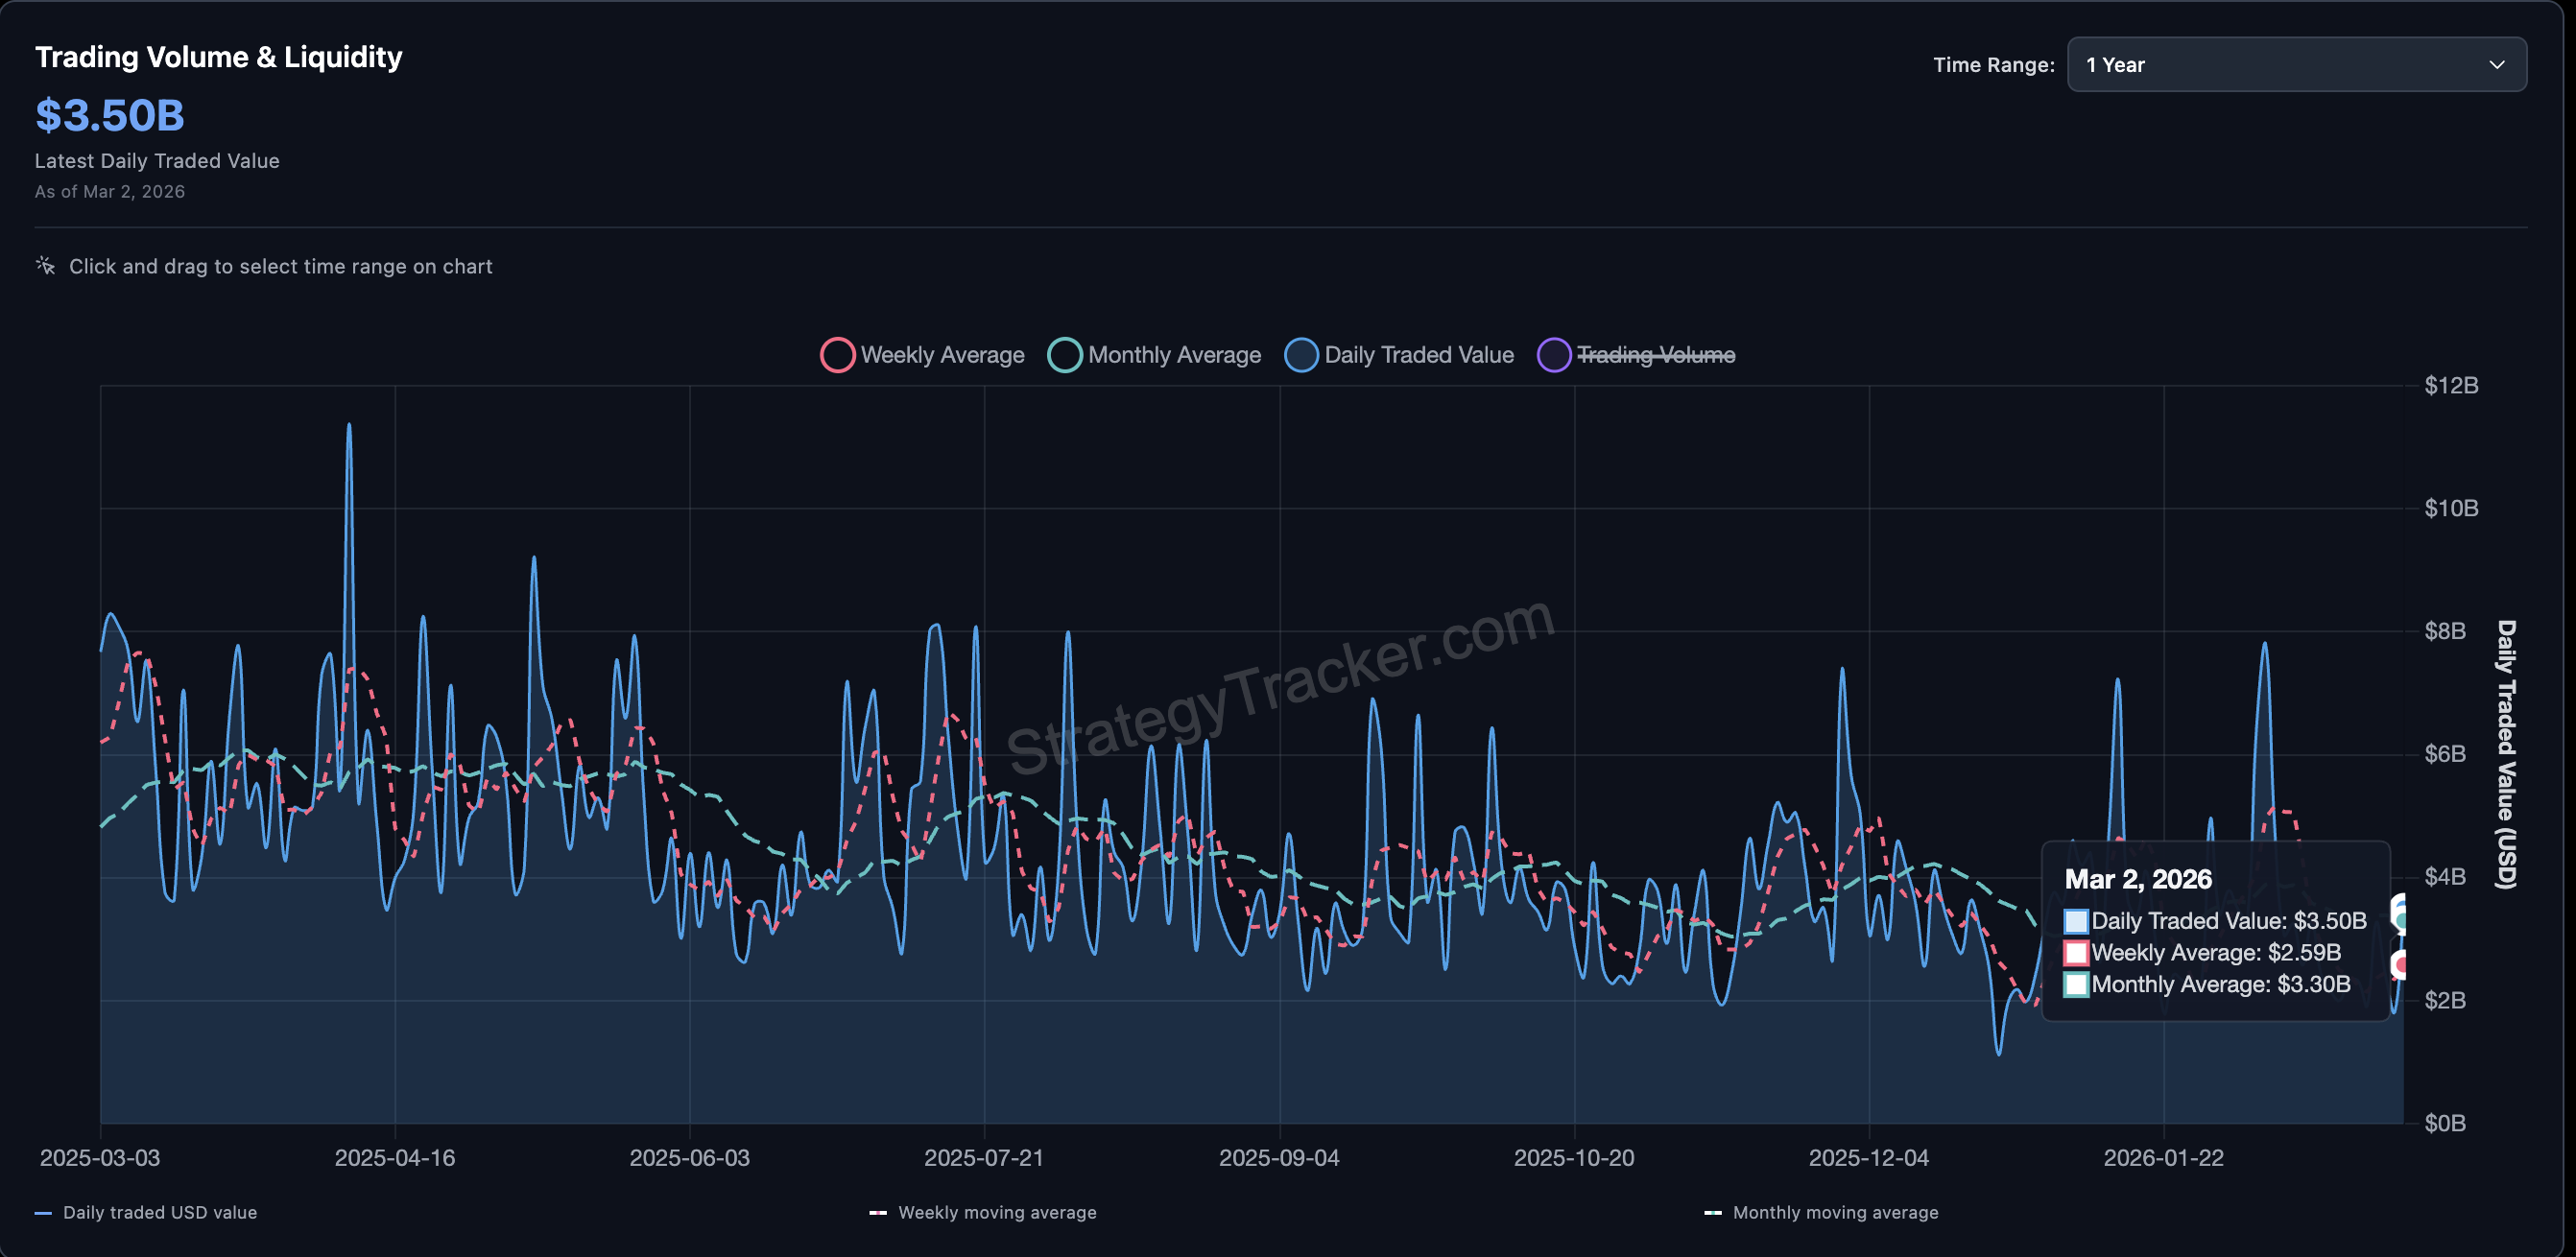
Against this backdrop, Strategy announced its 101st Bitcoin purchase on March 2nd. Total holdings now stand at 720,737 BTC, acquired at an average cost of $75,985.
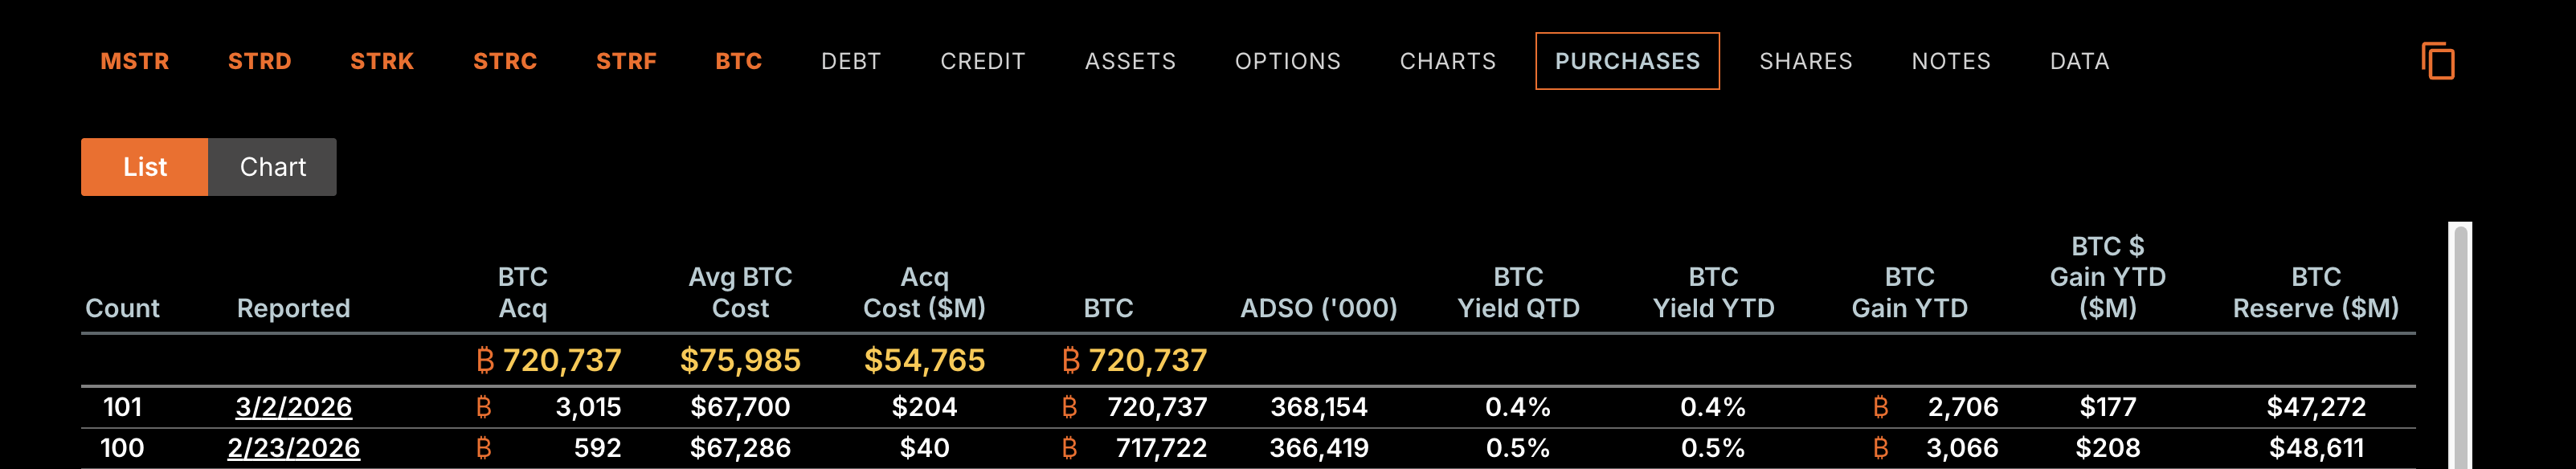
With the price of Bitcoin reaching nearly $67,000, positions are under water by about $6 billion to $7 billion. The company continues to buy. The market isn’t rewarding it. And indicators below the surface suggest Monday’s rebound may have been short-lived. The weakness may continue.
Momentum, cash flow, and option activity all fade together
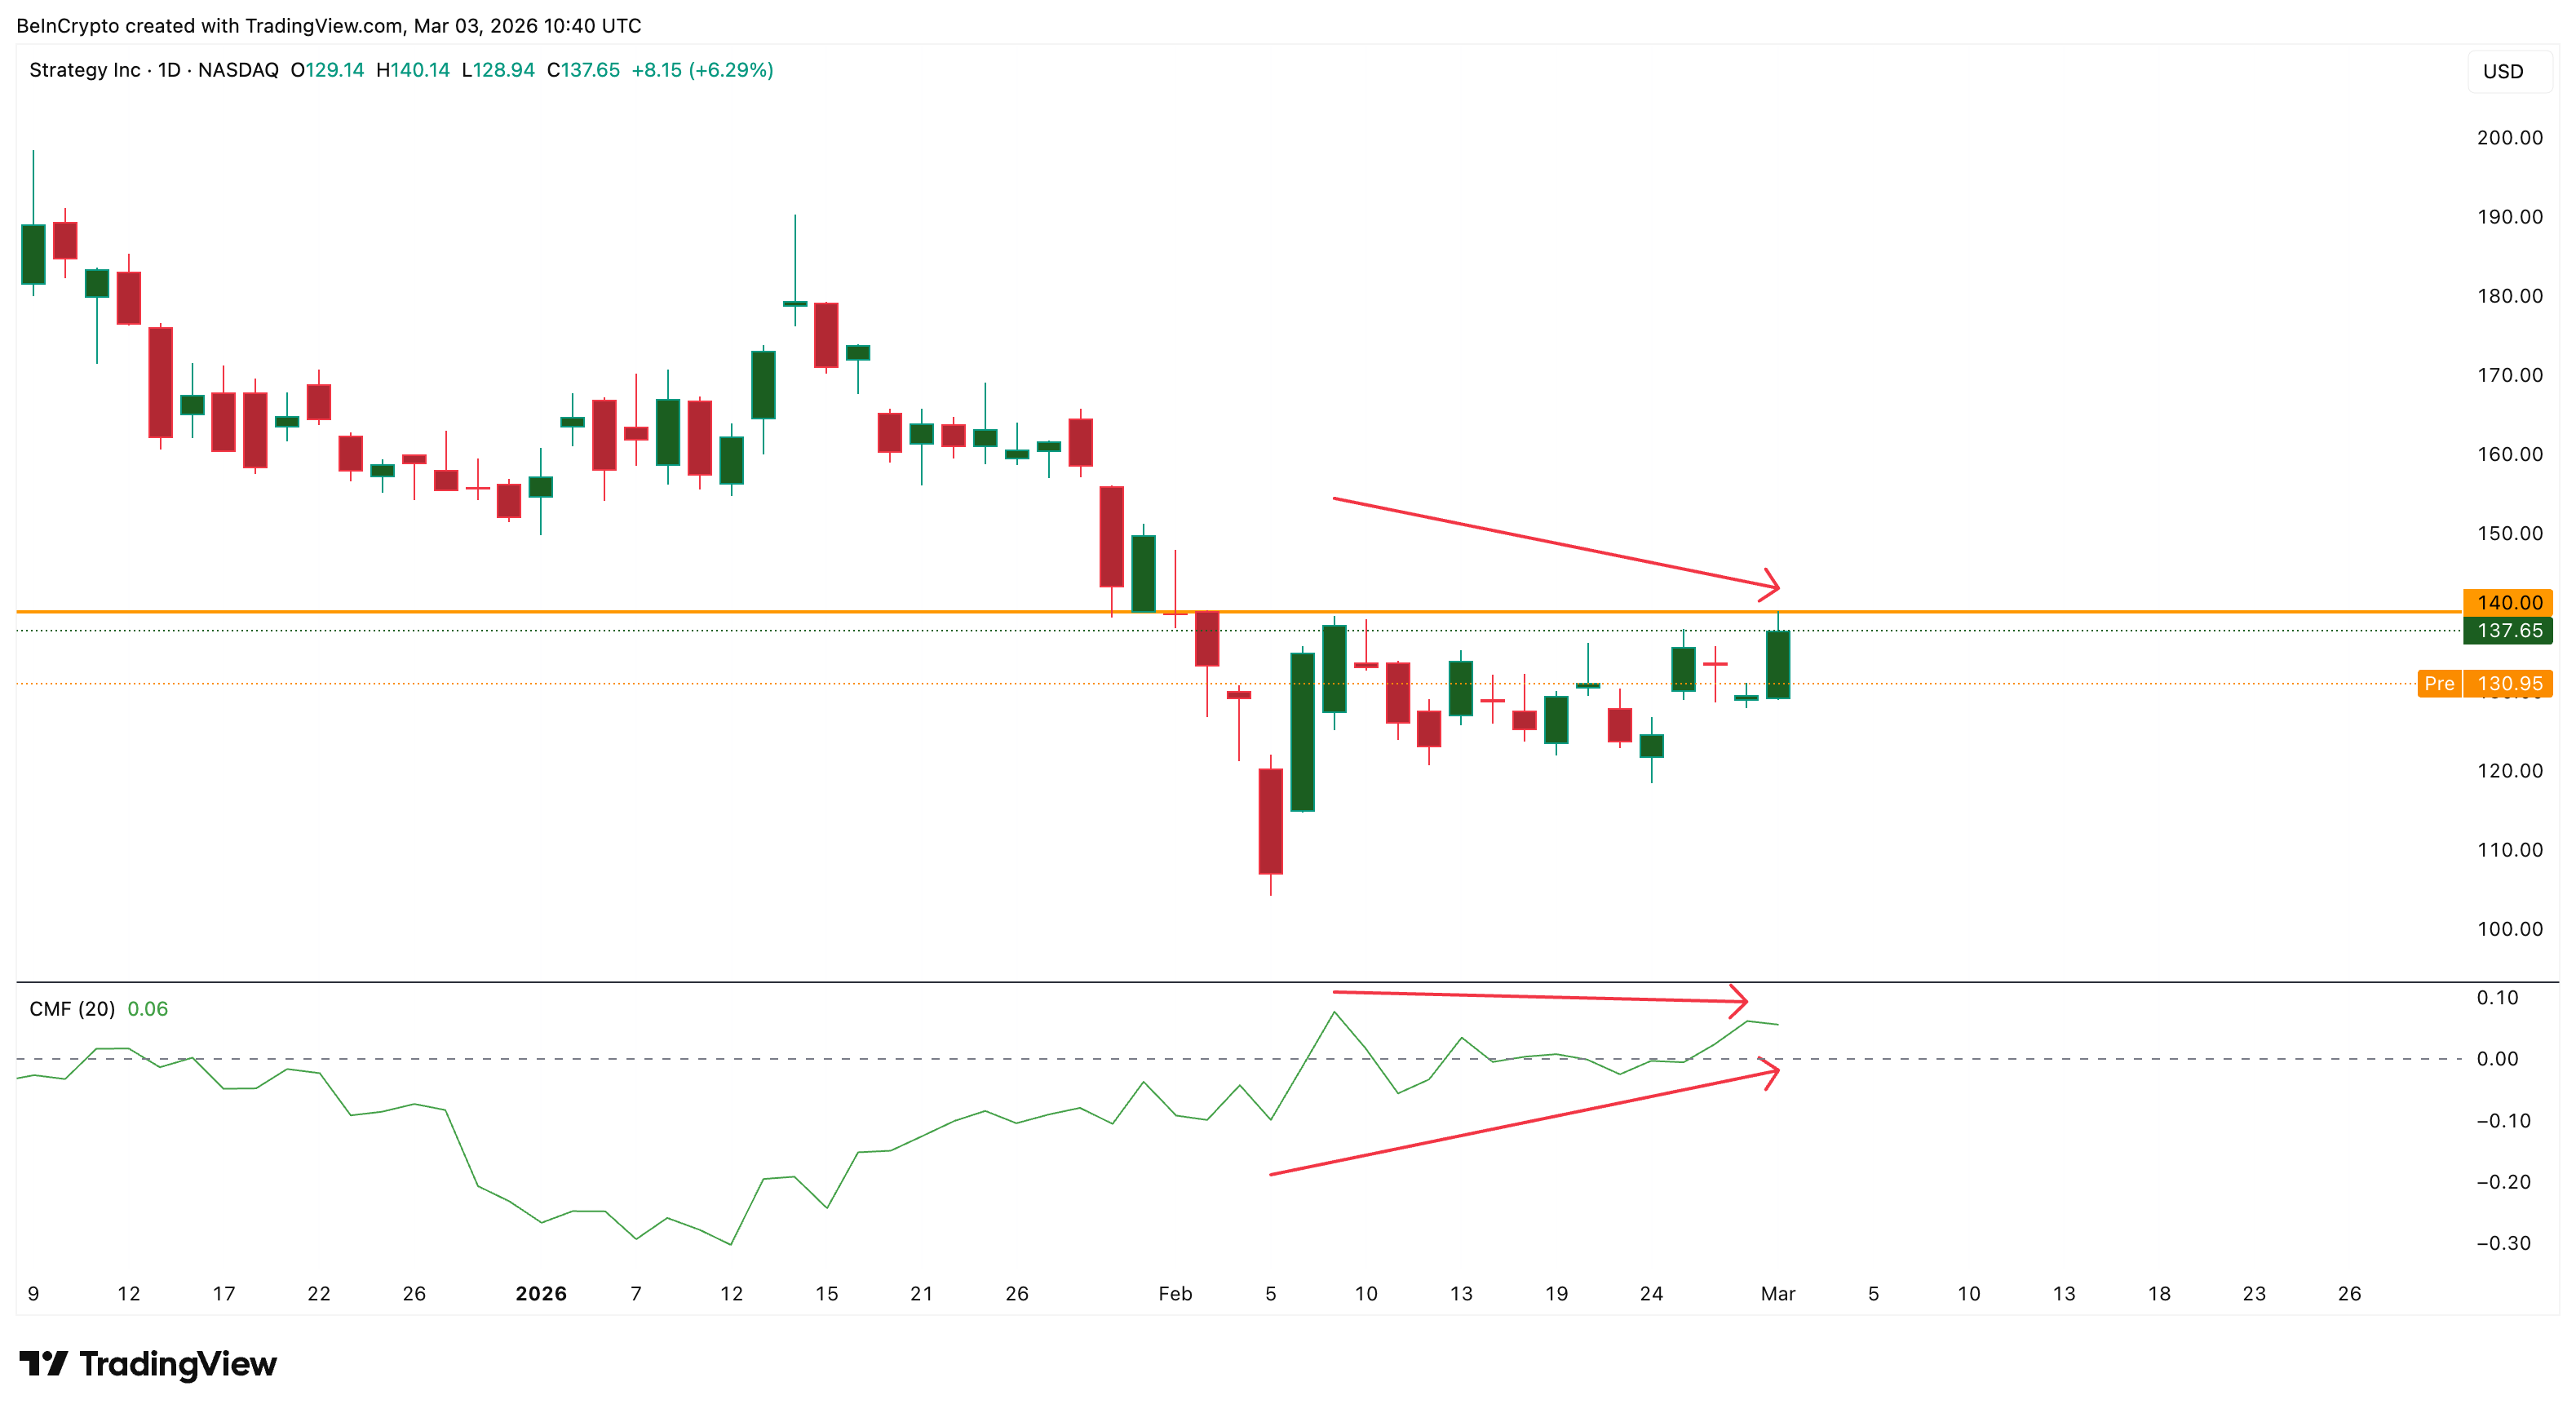
The Chaikin Money Flow (CMF) value of 0.06 ties the 101st purchase into the picture. CMFs are often used as a proxy for purchases by institutional investors. Despite Strategy adding 3,015 BTC, CMF did not show significant gains. Since mid-February, prices have been on a downward trend. While the movement in net CMF looks bullish, the indicator’s failure to make further highs relative to MSTR stock signals growing weakness.
If CMF falls below zero (which has not happened yet), we will confirm that net funds are flowing out of MSTR. This coincides with a 67% collapse in weekly trading value.
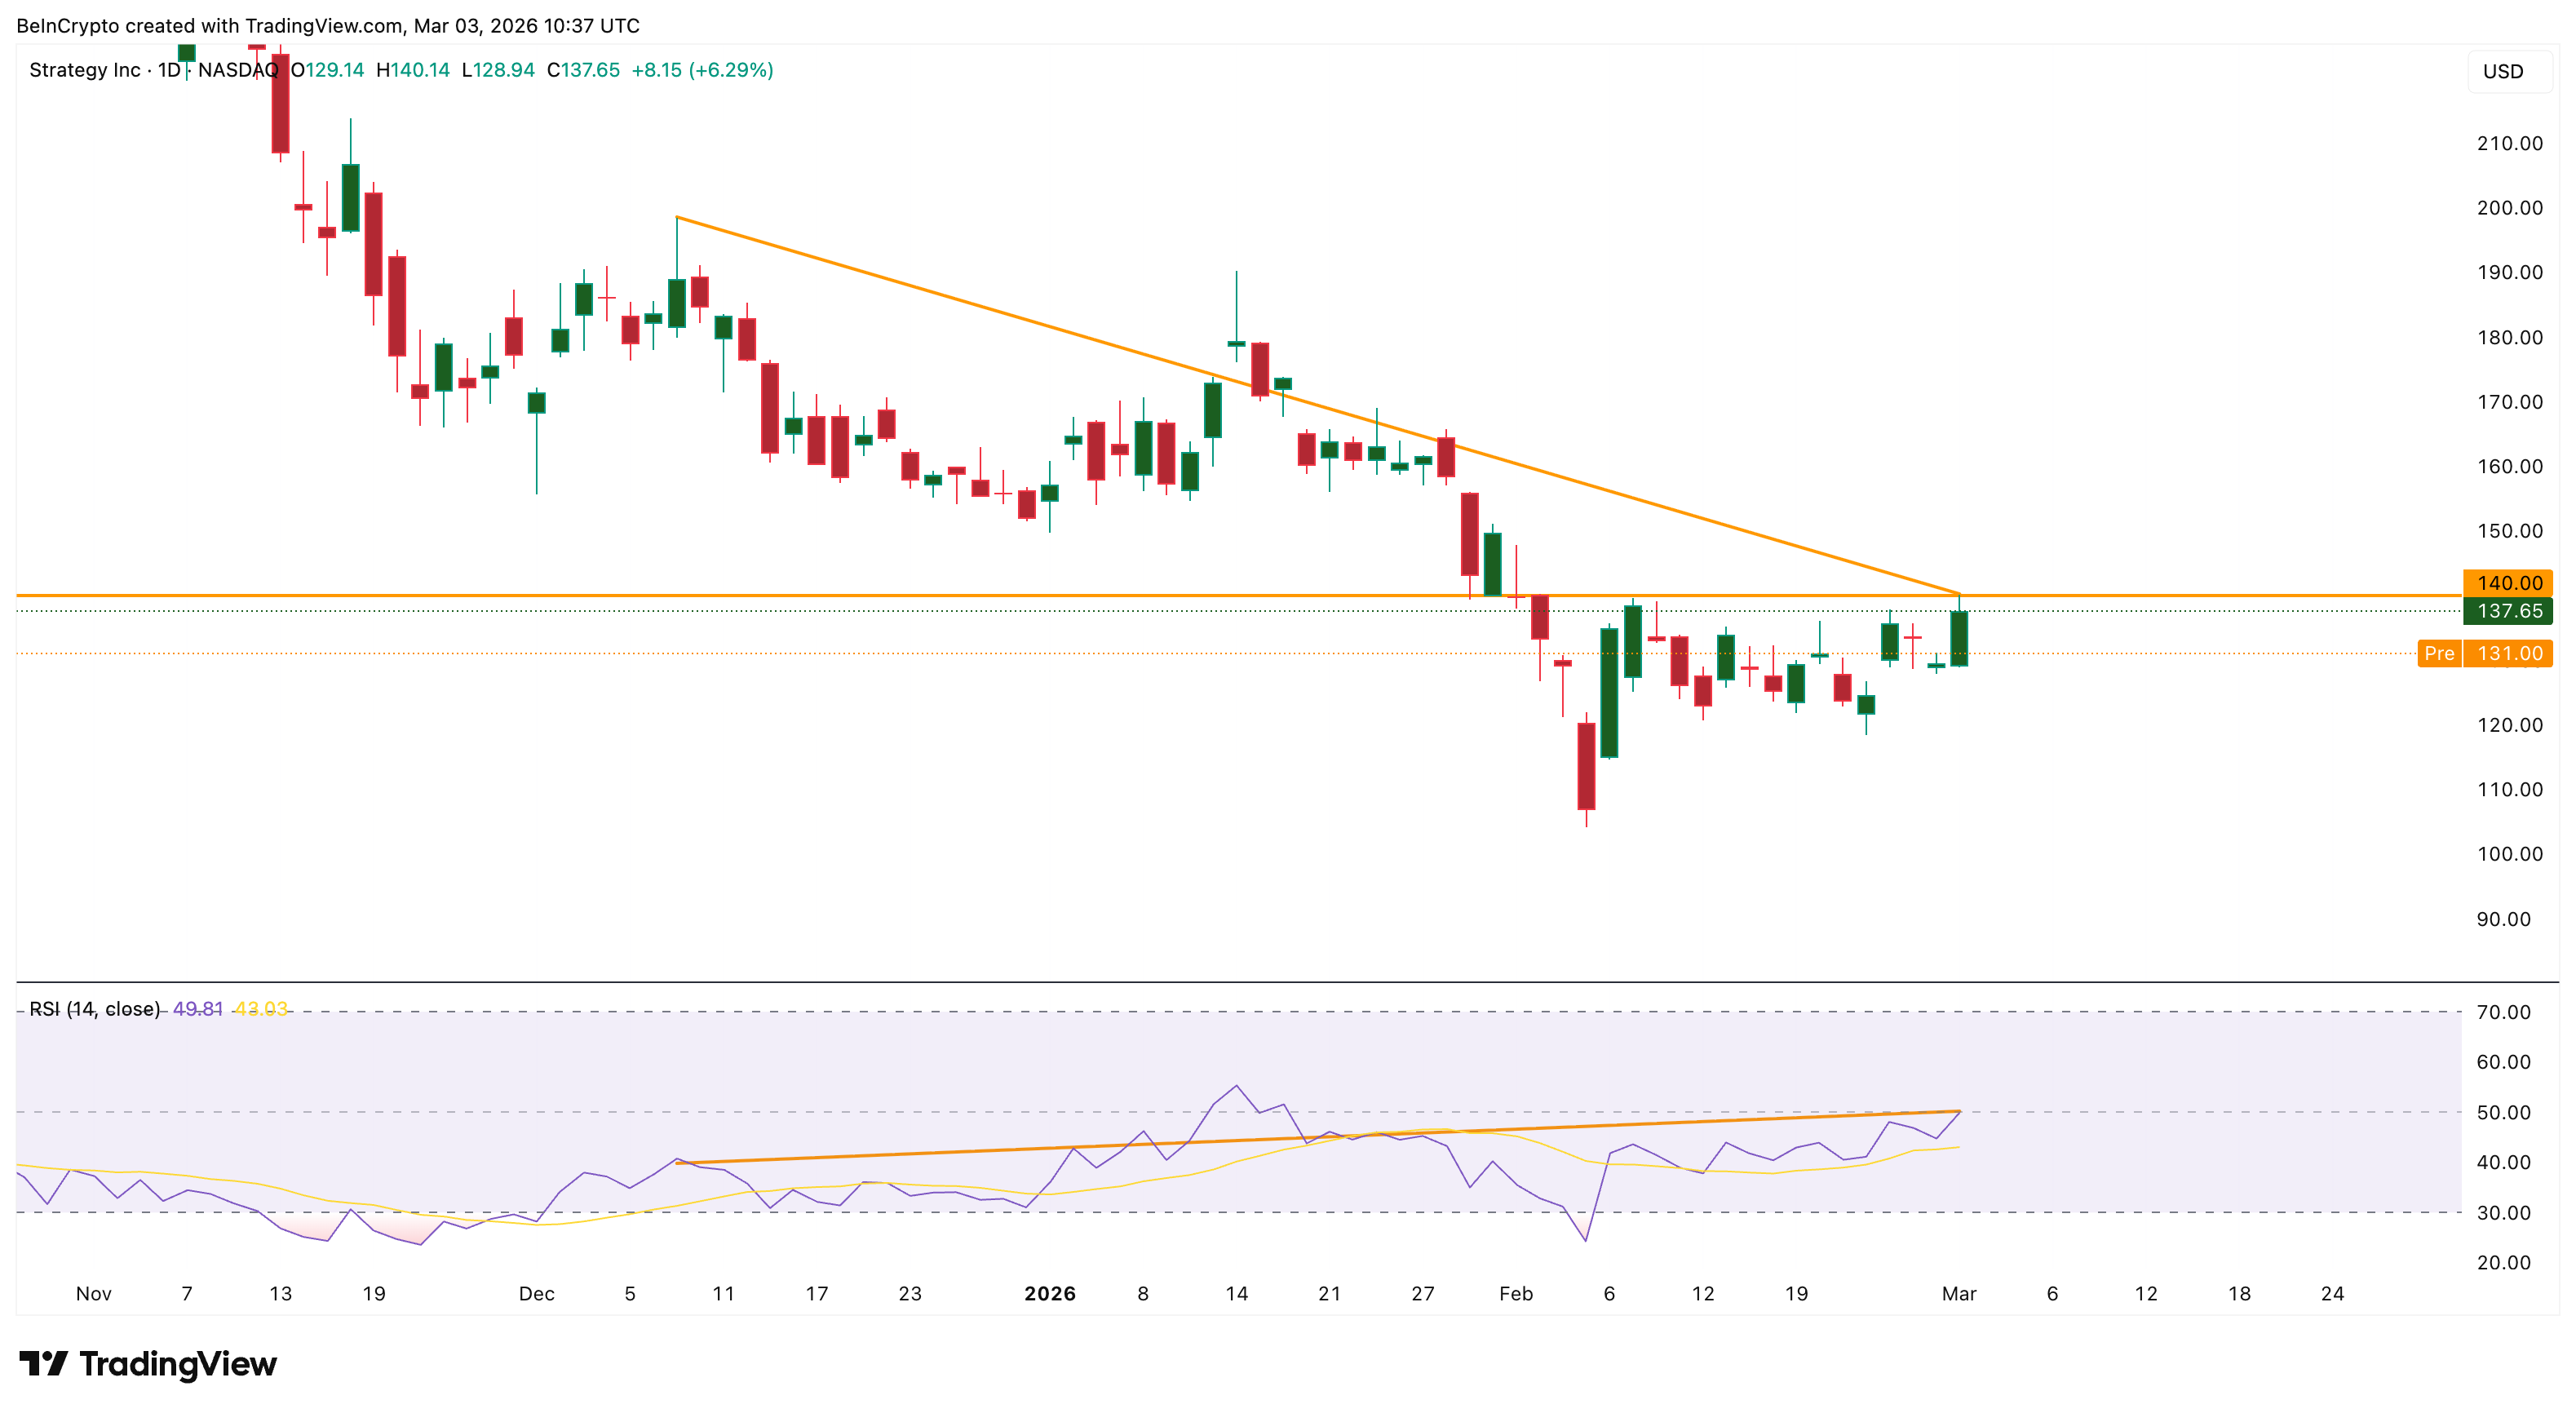
The Daily Relative Strength Index (RSI), a momentum indicator, is adding to this fading momentum. From December 9th to March 2nd, MSTR price has formed an even lower high. However, the RSI continues to reach new highs. This hidden bearish divergence signals a resumption of the broader downtrend and the possibility of a pullback. And this weakness confirms whether a net candlestick will form below $140.
Pre-market prices further confirm that risk confirmation.
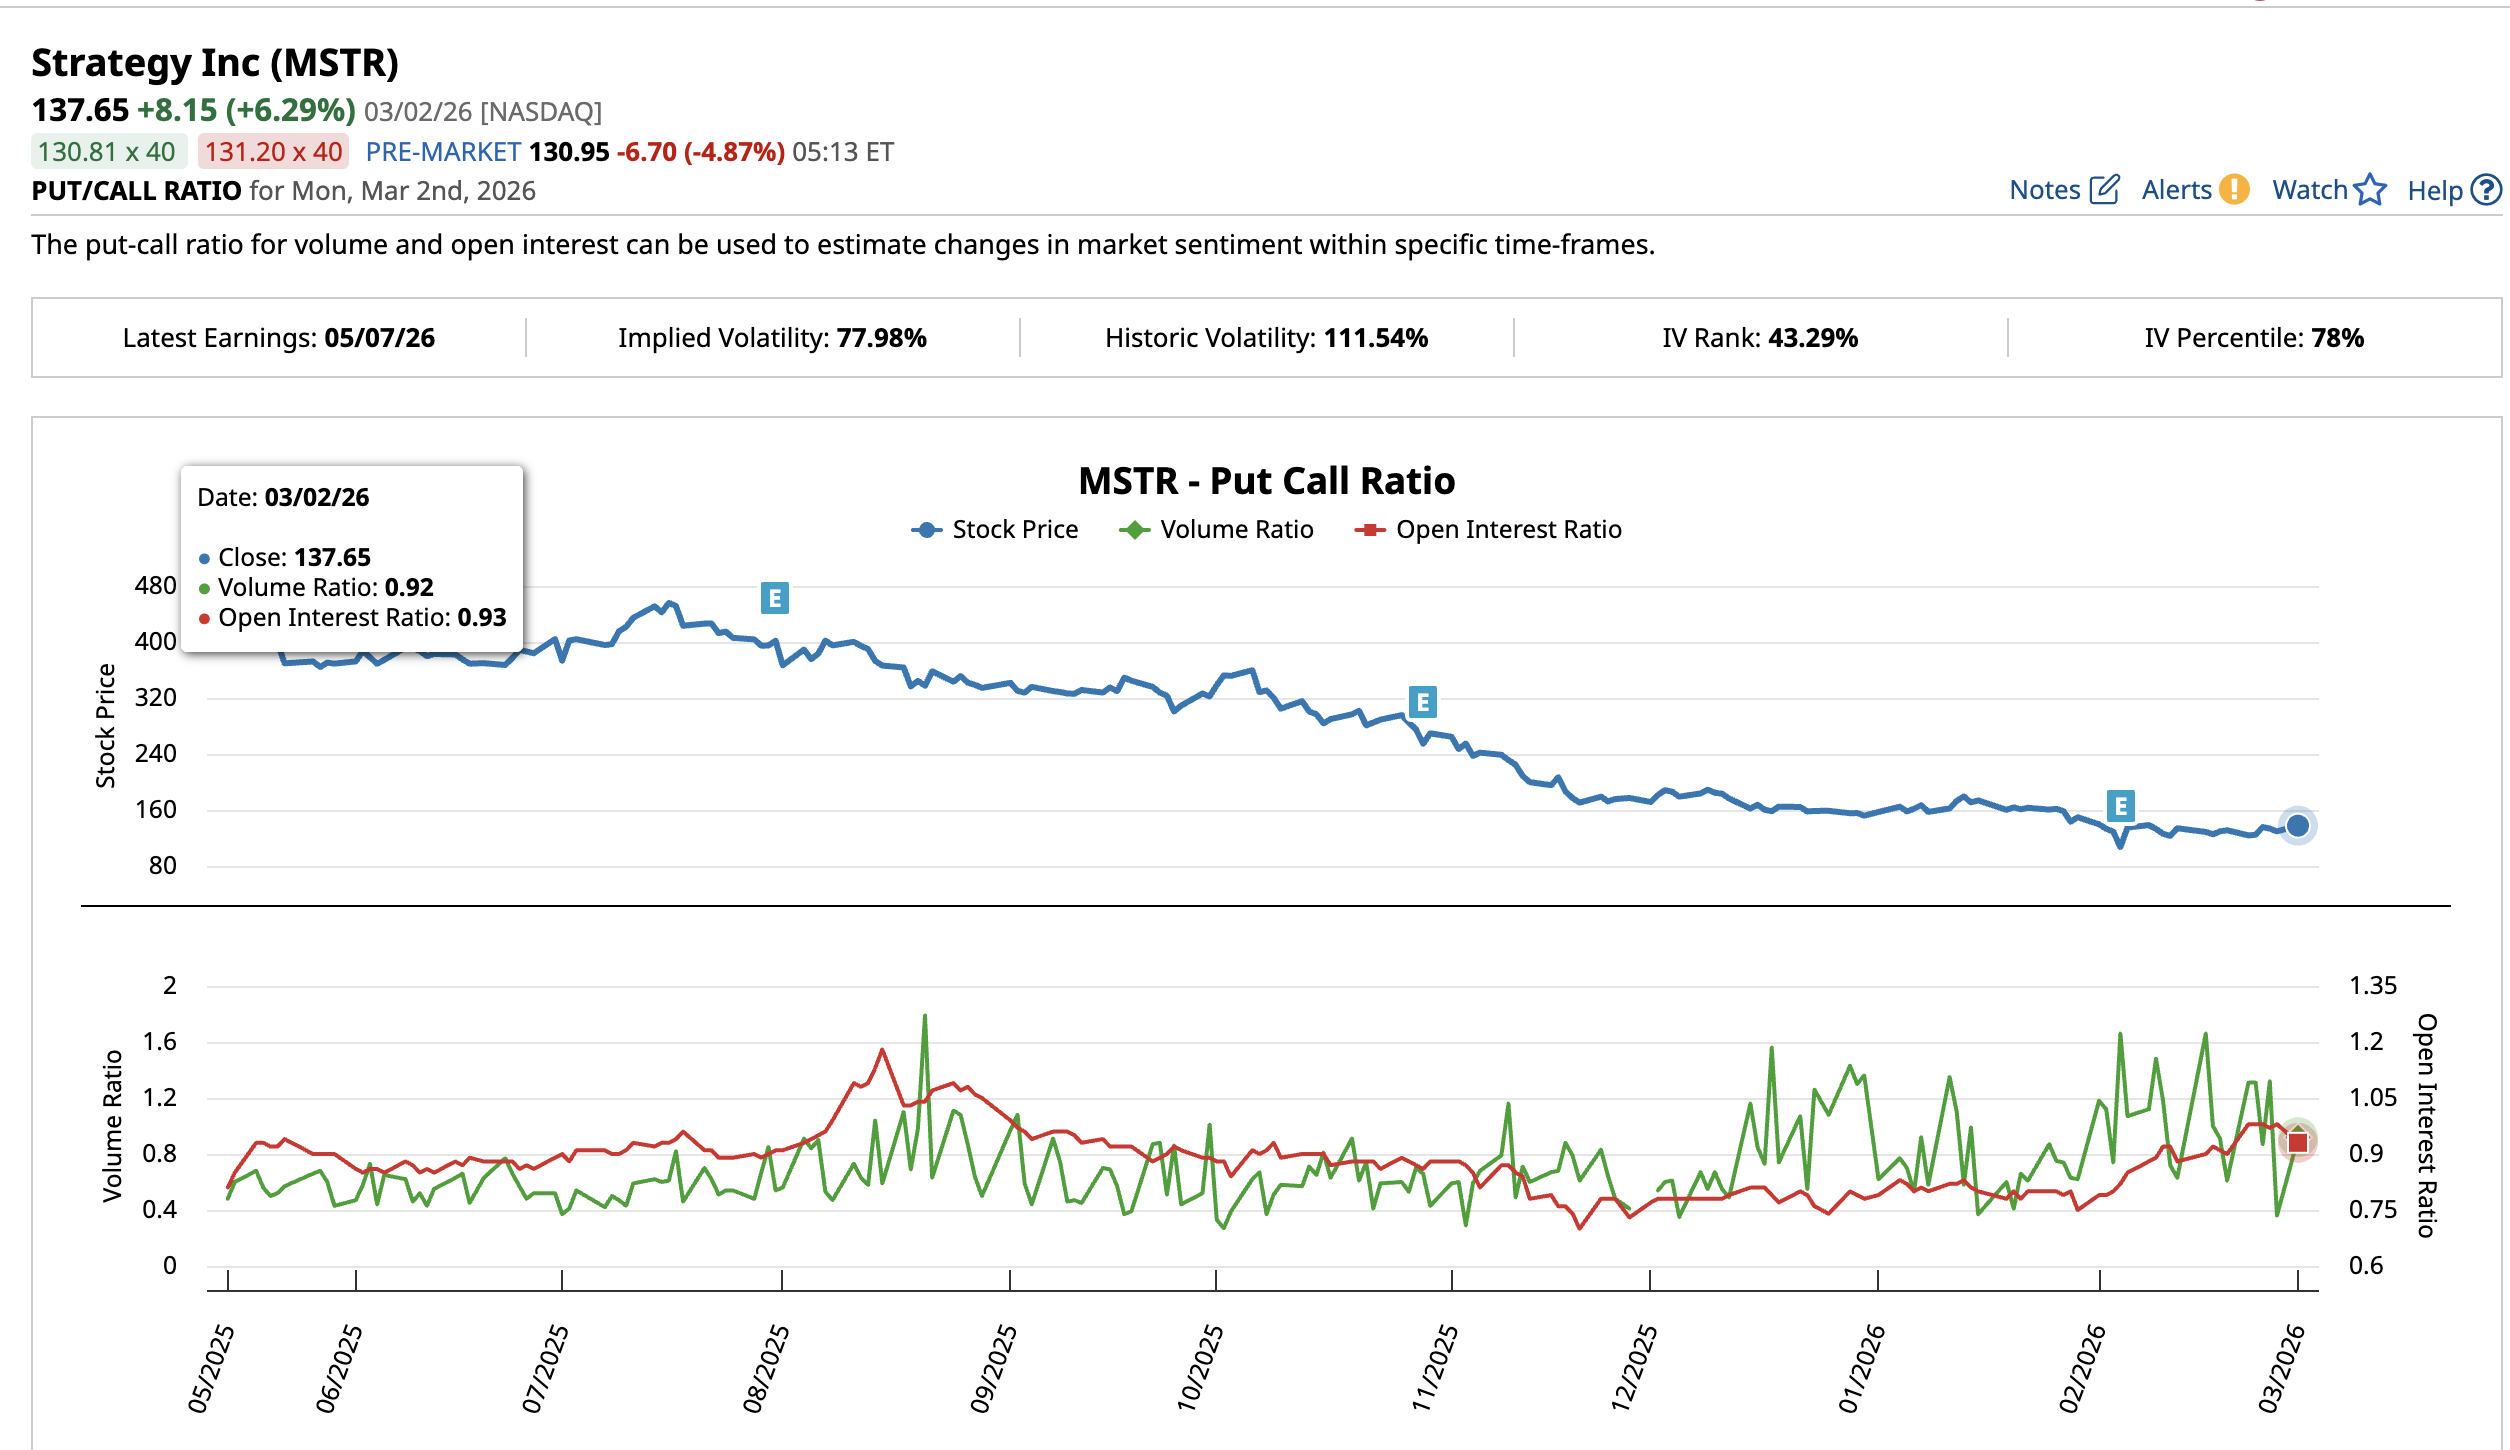
Options data tells a similar story. The put/call volume ratio is approximately neutral at 0.92 and the open interest ratio is 0.93, with approximately the same amount of money flowing into bullish calls and bearish puts.
The panic of February has faded, but there is no strong belief to replace it. The implied volatility of 77.98% is lower than the previously observed realized volatility of 105.8%, meaning the market expects calmer days ahead. Possibly if BTC continues to move within the range.
Want more insights like this? Sign up for Editor Harsh Notariya’s Daily Crypto Newsletter here.
However, the actual MicroStrategy stock price movement is not cooperative. Traders are sitting on the sidelines, not actively betting in either direction, and this is related to similar declines in trading volumes and even CMFs.
MicroStrategy stock price prediction: $124 makes all the difference
MSTR has been trapped between $140 and $124 for almost four weeks barring some volatile moves. Monday’s rally hit resistance at $140 and reversed. The $124 floor, or the 0.236 Fibonacci level, is currently the key level to track, and is down almost 10% from Monday’s close.
Weight of Evidence: Hidden Bearish RSI Divergence, CMF Weakness, Neutral Option Positioning, Macro Pressures, Sharp Volume Decline, Downside Tilting
If the day closes below $124, the next level begins at $115. Below that, $107 and $100 are of interest.
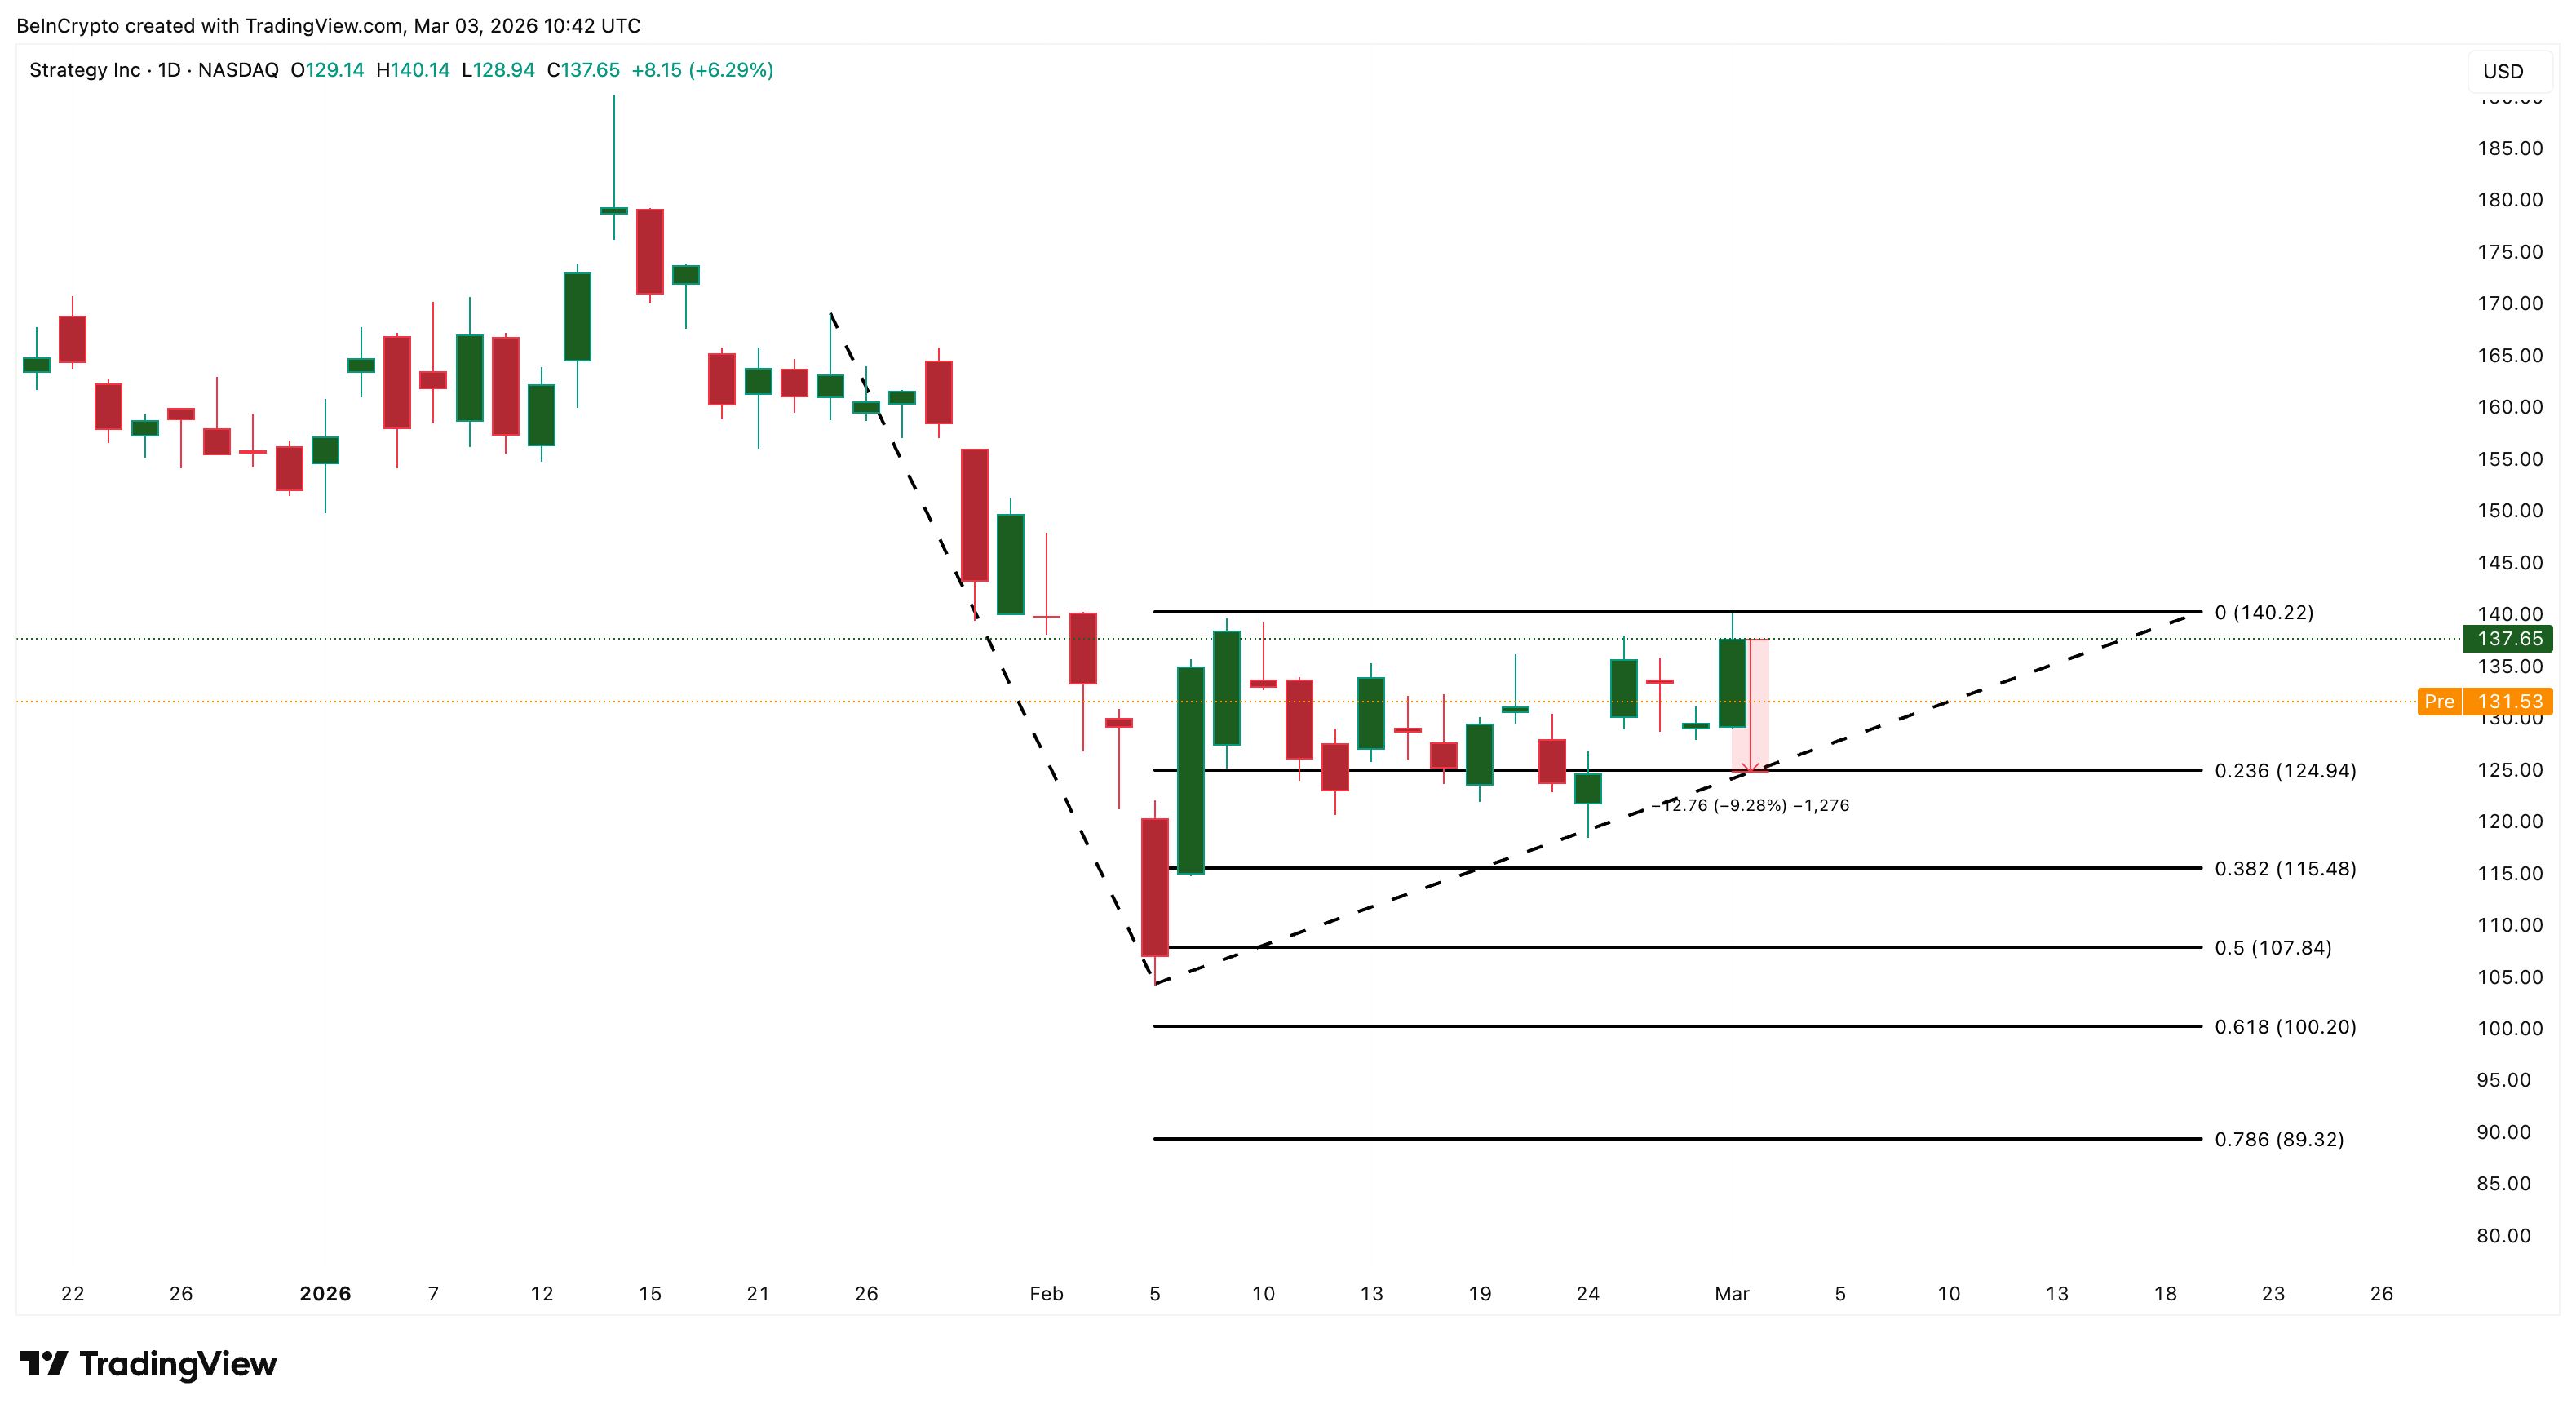
Still, one catalyst for the upside remains. If Bitcoin recovers and sustains above $69,000, a decisive close above $140 on strong volume will invalidate the bear market and trigger sharp position changes. Given MSTR’s amplified volatility, these moves could become even more widespread.
Until then, $124 is an important line for MicroStrategy’s stock price. Press and hold to continue the range. Losing it can accelerate the correction.