

Bitcoin continues to trade around $92,000 after this week’s rally, but a growing cluster of on-chain indicators now suggests the market is already in a bearish cycle.
This is in sharp contrast to recent predictions from market leaders such as Tom Lee and Arthur Hayes, who argue that Bitcoin could still end the year significantly higher.
Sponsored Sponsored
Bullish predictions and data collide
Lee recently relaxed his previous $250,000 target and now expects Bitcoin to remain above $100,000 until the end of the year.
Arthur Hayes, on the other hand, remains more positive, predicting that the recent decline is down to the low $80,000s of the cycle, with the potential for a move towards $200,000-$250,000.
However, the current market structure does not match either scenario.
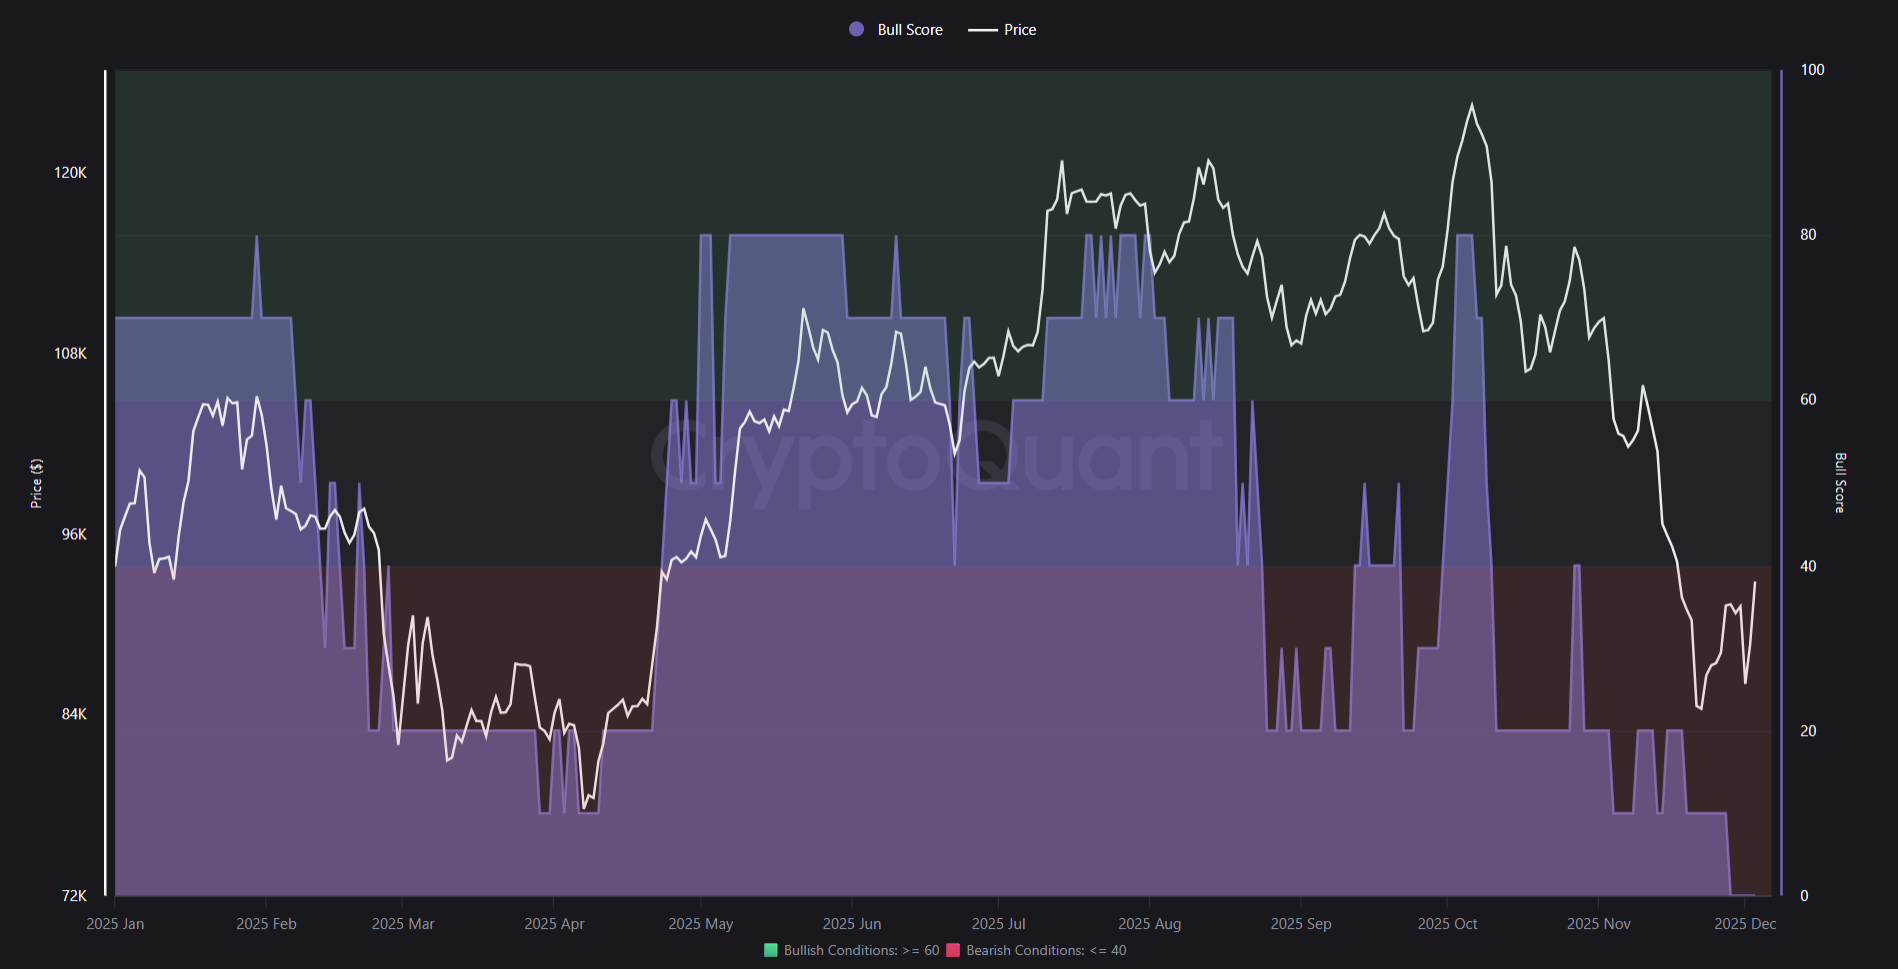
CryptoQuant’s Bull Score Signals composite shows why. During previous bull phases, including late 2023 and early 2025, the model showed broad green conditions across valuations, demand growth, network activity, and stablecoin liquidity.
Since mid-2025, these components have consistently turned red. The MVRV Z-score has turned into overheating territory, network activity has weakened, and the purchasing power of the stablecoin has declined.
This pattern resembles the early stages of a 2022 recession rather than a continuation of the 2025 bull market.
Sponsored Sponsored
The Bull Score Index also provides a more granular view. Bitcoin spent the first half of 2025 in bullish territory above 60.
By late August, the score began to decline rapidly, falling below 40 in October and remaining flat until November despite short-term price fluctuations.
The latest readings are in the 20-30 range, moving deep into bearish conditions. The rebound from last week’s lows has done little to change the underlying cycle signals.
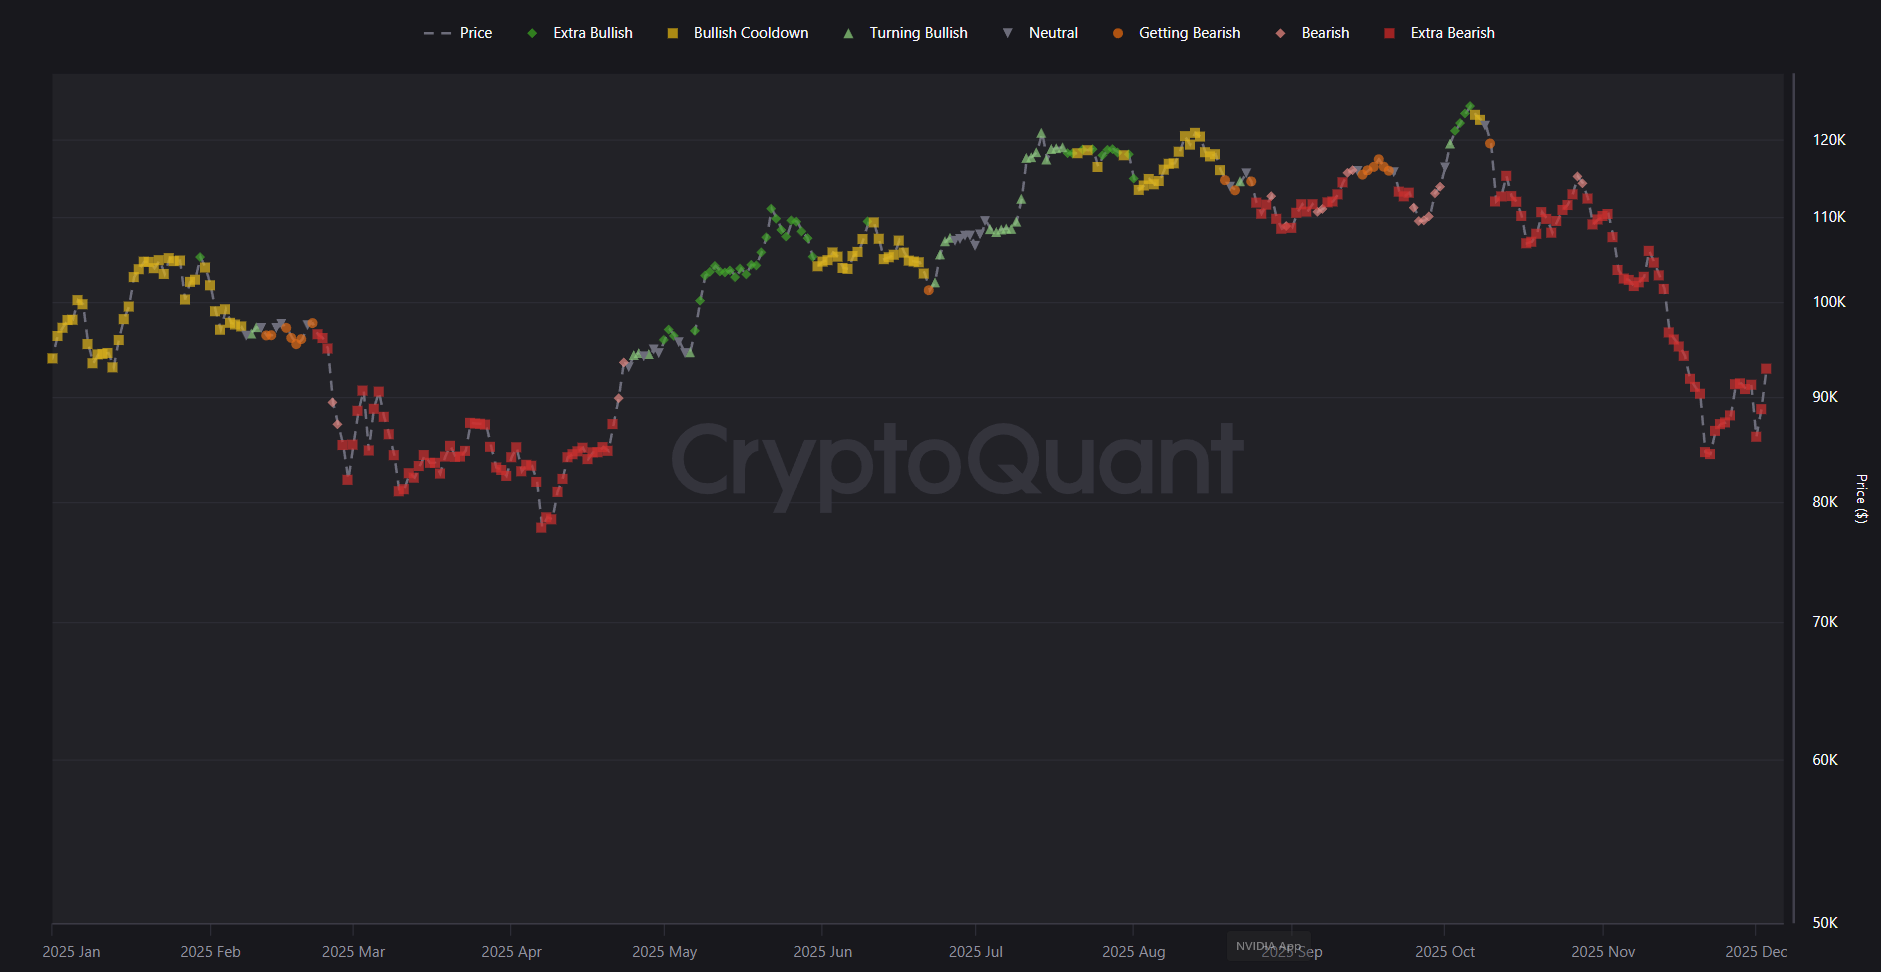
Another, bull score mapped to price, reinforces this view. The model has transitioned from a green “super bullish” signal earlier this year to sustained red “bearish” and “super bearish” readings through September, October, and November.
Even the recent rally towards $92,000 reflects the distribution phase seen at previous cycle highs and is classified as a rally in the bearish zone.
Sponsored Sponsored
Momentum indicators strengthen the case for Bitcoin bearishness
Market momentum indicators now reflect the same cyclical changes. The RSI remains neutral near 50, indicating a lack of confidence in this week’s rally.
Chaikin money flows have remained negative for most of the month, reflecting continued capital outflows despite a recovery in prices.
The MACD recently turned positive, but the histogram already shows a weakening in amplitude. This shows that the movement lacks sustained momentum.
Sponsored Sponsored
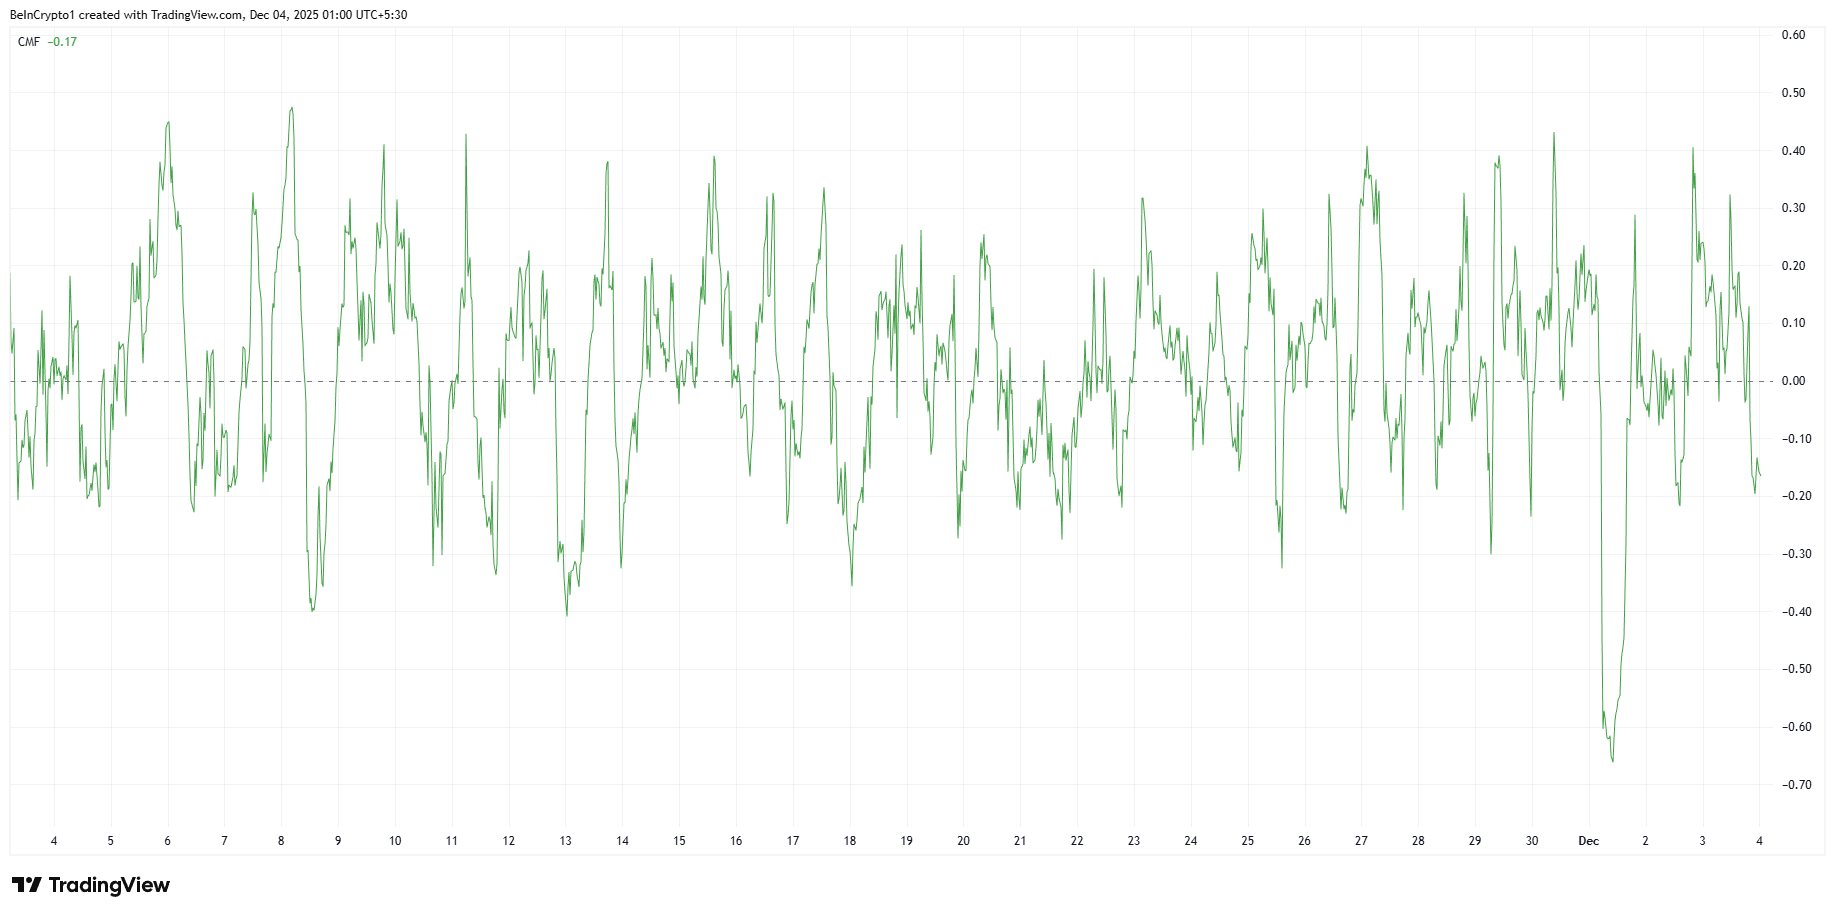
Additional signals increase alertness. The short-term spike with the RSI above 70 over the past few days has been unsustainable, indicating that sellers are aggressive on every breakout attempt. The failure of the CMF to return to positive territory highlights that distribution, not accumulation, is taking place.
On the other hand, MACD’s fragile crossover mirrors what has been seen during past bear market rallies, where momentum briefly improves and then reverses.
Collectively, on-chain, liquidity, and momentum indicators point to a structural transition to a bearish cycle.
Tom Lee and Arthur Hayes claim that Bitcoin could return to its former strength, but current market data suggests the opposite.
Unless stablecoin liquidity, network activity, and demand growth decisively recover, Bitcoin’s recent recovery is likely to be a temporary recovery rather than the start of a new upswing.