

Tom Lee’s Bitmine stock has struggled to recover despite its deep ties to Ethereum. While BitMine’s stock price has been mostly flat for the past few days, it’s still down a hefty 30% over the past month, mirroring Ethereum’s own decline. This weakness occurred even though the company continued to increase its exposure to Ethereum during 2026.
Such aggressive accumulation usually supports price strength. However, BMNR stock continues to show signs of structural weakness. This raises uncomfortable questions. Why don’t stock prices respond positively to the expansion of Ethereum positions?
BitMine’s Ethereum purchases continue, but two indicators show financial institutions remain hesitant
BitMine significantly increased its Ethereum holdings in 2026, adding 279,158 ETH to its treasury as of February 22nd. The latest additions took place between February 17th and February 22nd, adding over 51,000 ETH.
This steady accumulation confirms the company’s long-term belief in Ethereum. However, the stock’s technical structure tells a different story.
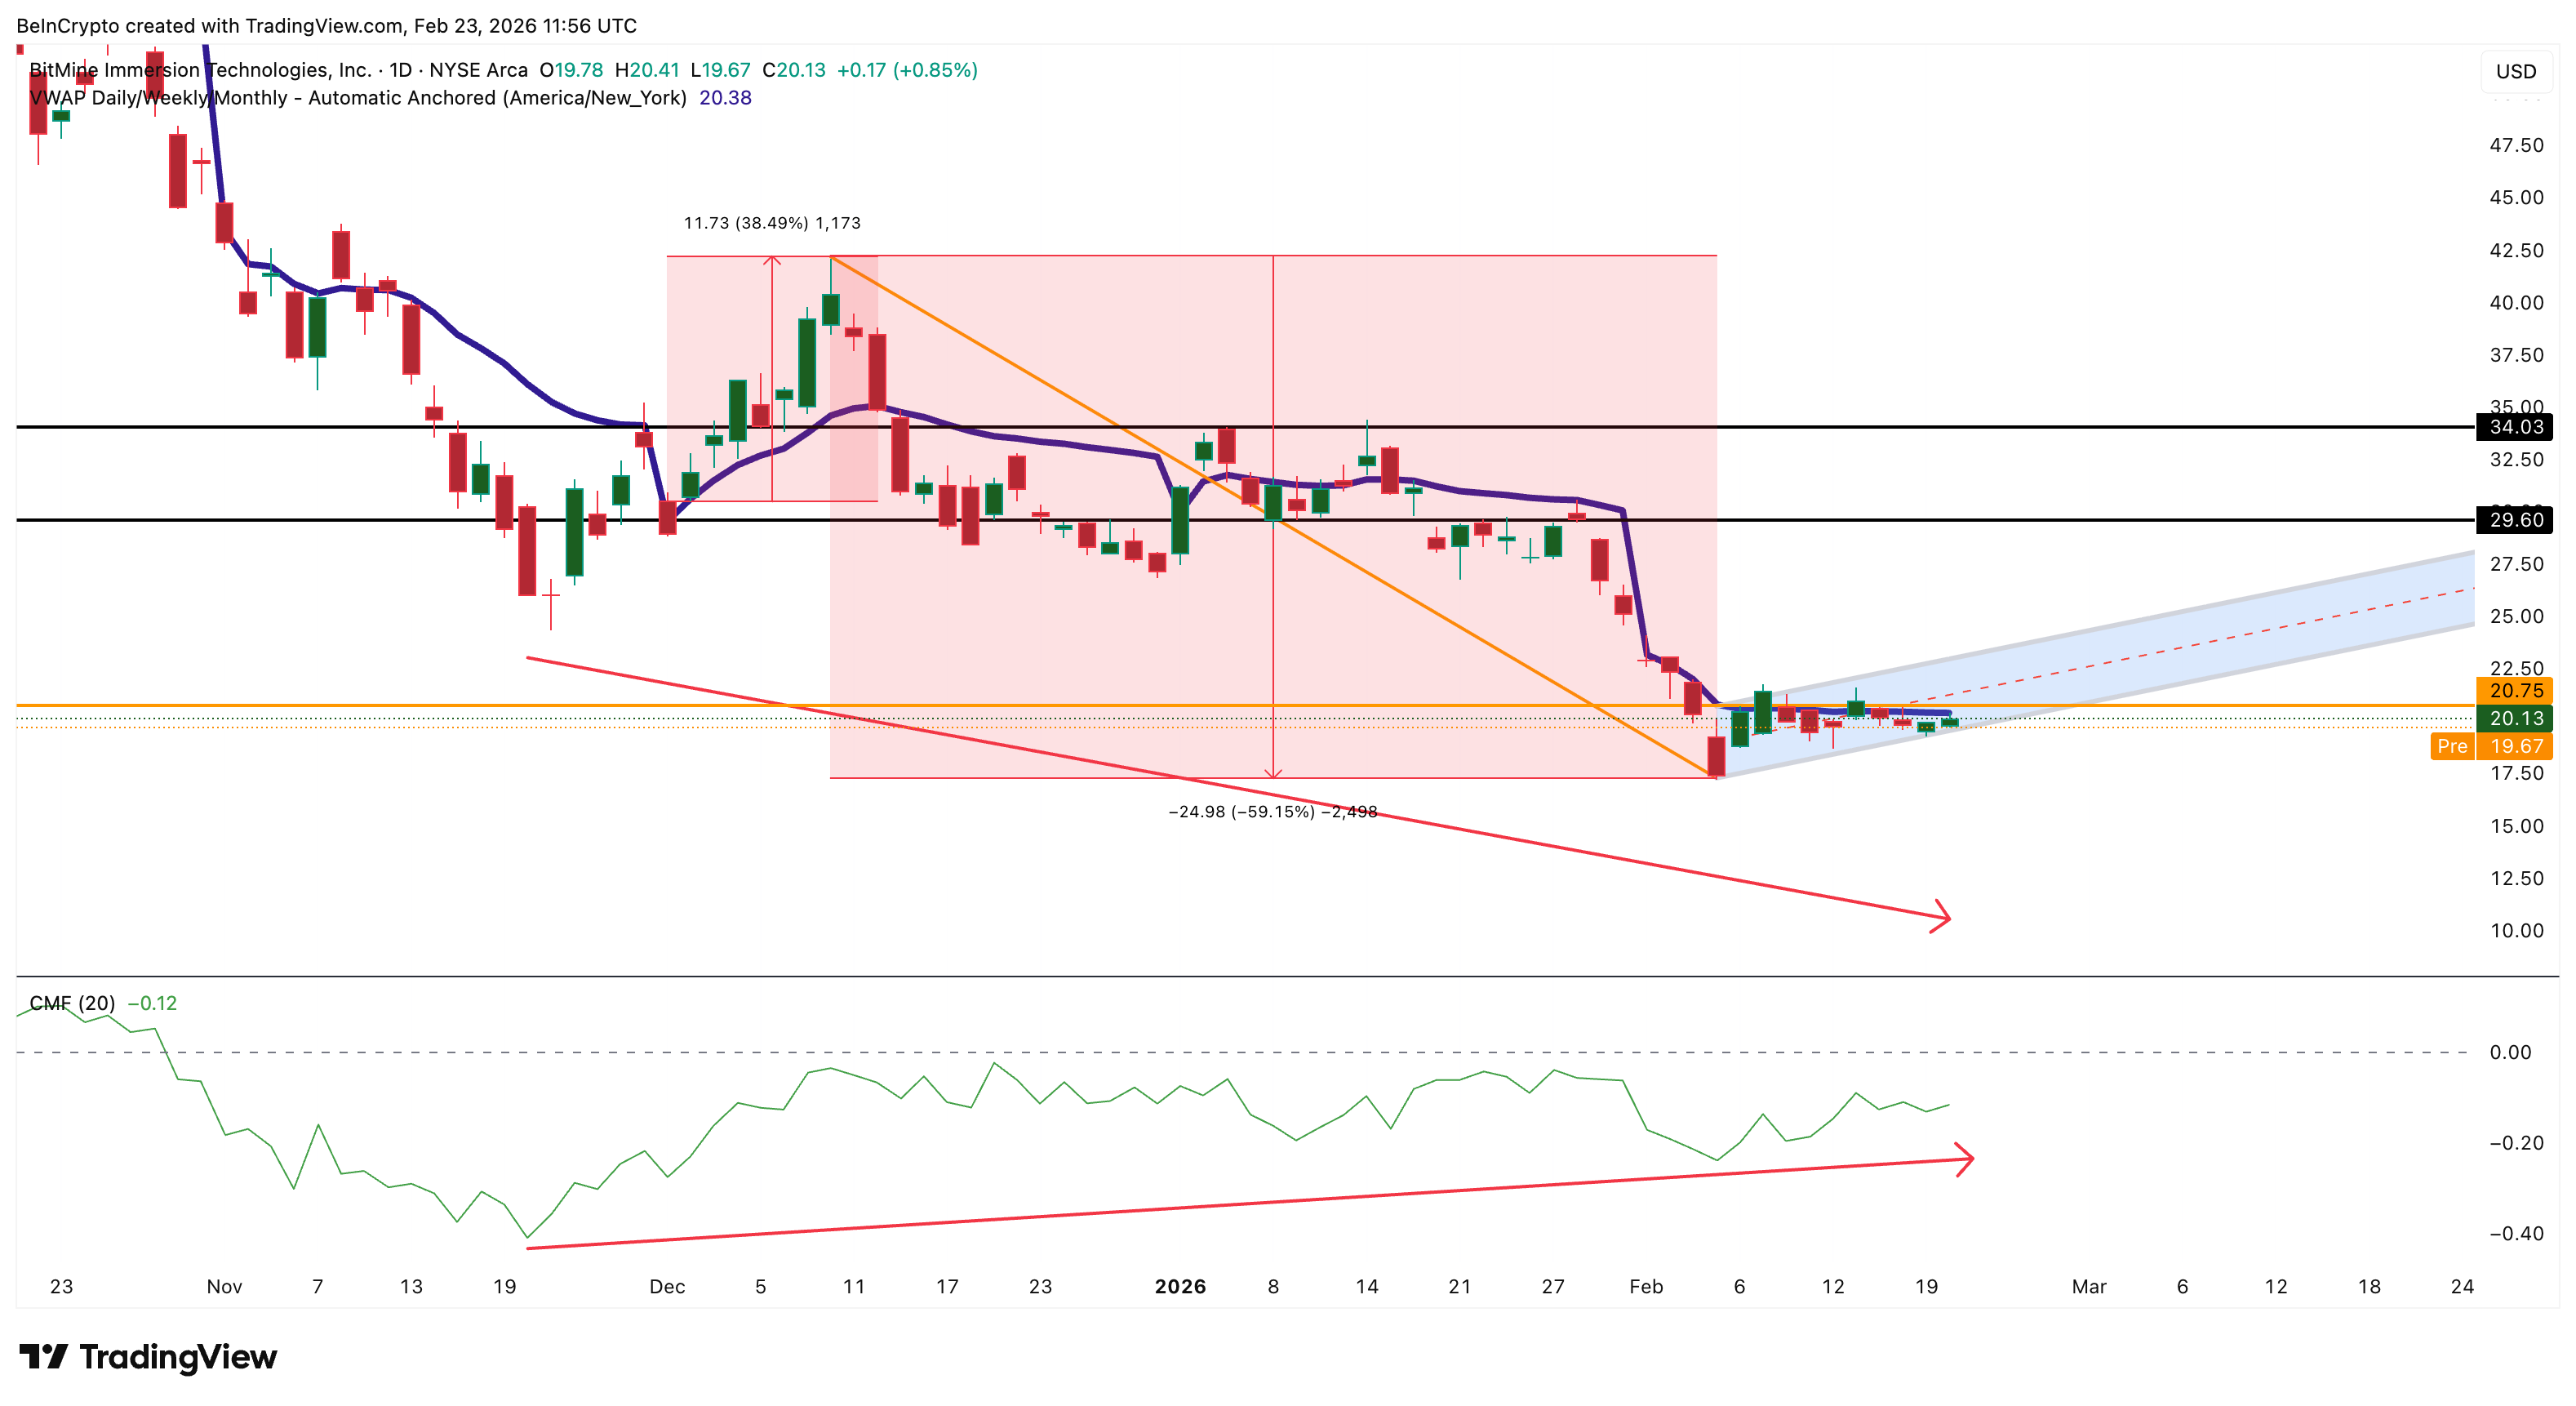
BitMine remains trapped inside a bearish flag pattern. A bearish flag pattern forms when a temporary rebound occurs within a broader downtrend. These patterns often resolve with a drop if the strong buy does not return. For now, the predicted risk is near the pole high of 60%.
At the same time, Bitmine stock has fallen below its monthly volume weighted average price (VWAP) and is currently trading around $20.38.
VWAP represents volume-weighted average price and is widely used as a proxy for institutional positioning. Trading below VWAP suggests that institutions are still holding defensive positions and have not fully returned as buyers.
Want more insights like this? Sign up for Editor Harsh Notariya’s Daily Crypto Newsletter here.
This hesitation also shows up in the Chaikin Money Flow (CMF) indicator. CMF combines price and volume data to measure whether large investors are buying and selling.
The CMF has been rising against the downtrend since late November, indicating that selling pressure is easing, but it remains below zero. This means that while institutional investors’ selling has eased, strong buying has not yet begun.
Taken together, VWAP and CMF show that institutional investors remain cautious despite BitMine’s aggressive Ethereum accumulation.
The historical importance of crossing the VWAP line is clear. When that happened in early December, BitMine’s stock price rose nearly 39% to a local peak.
If institutions aren’t buying yet, what’s stopping the stock from dropping further?
Retail buying and bullish divergence provide temporary support
At the moment, retail investors appear to be providing the main support.
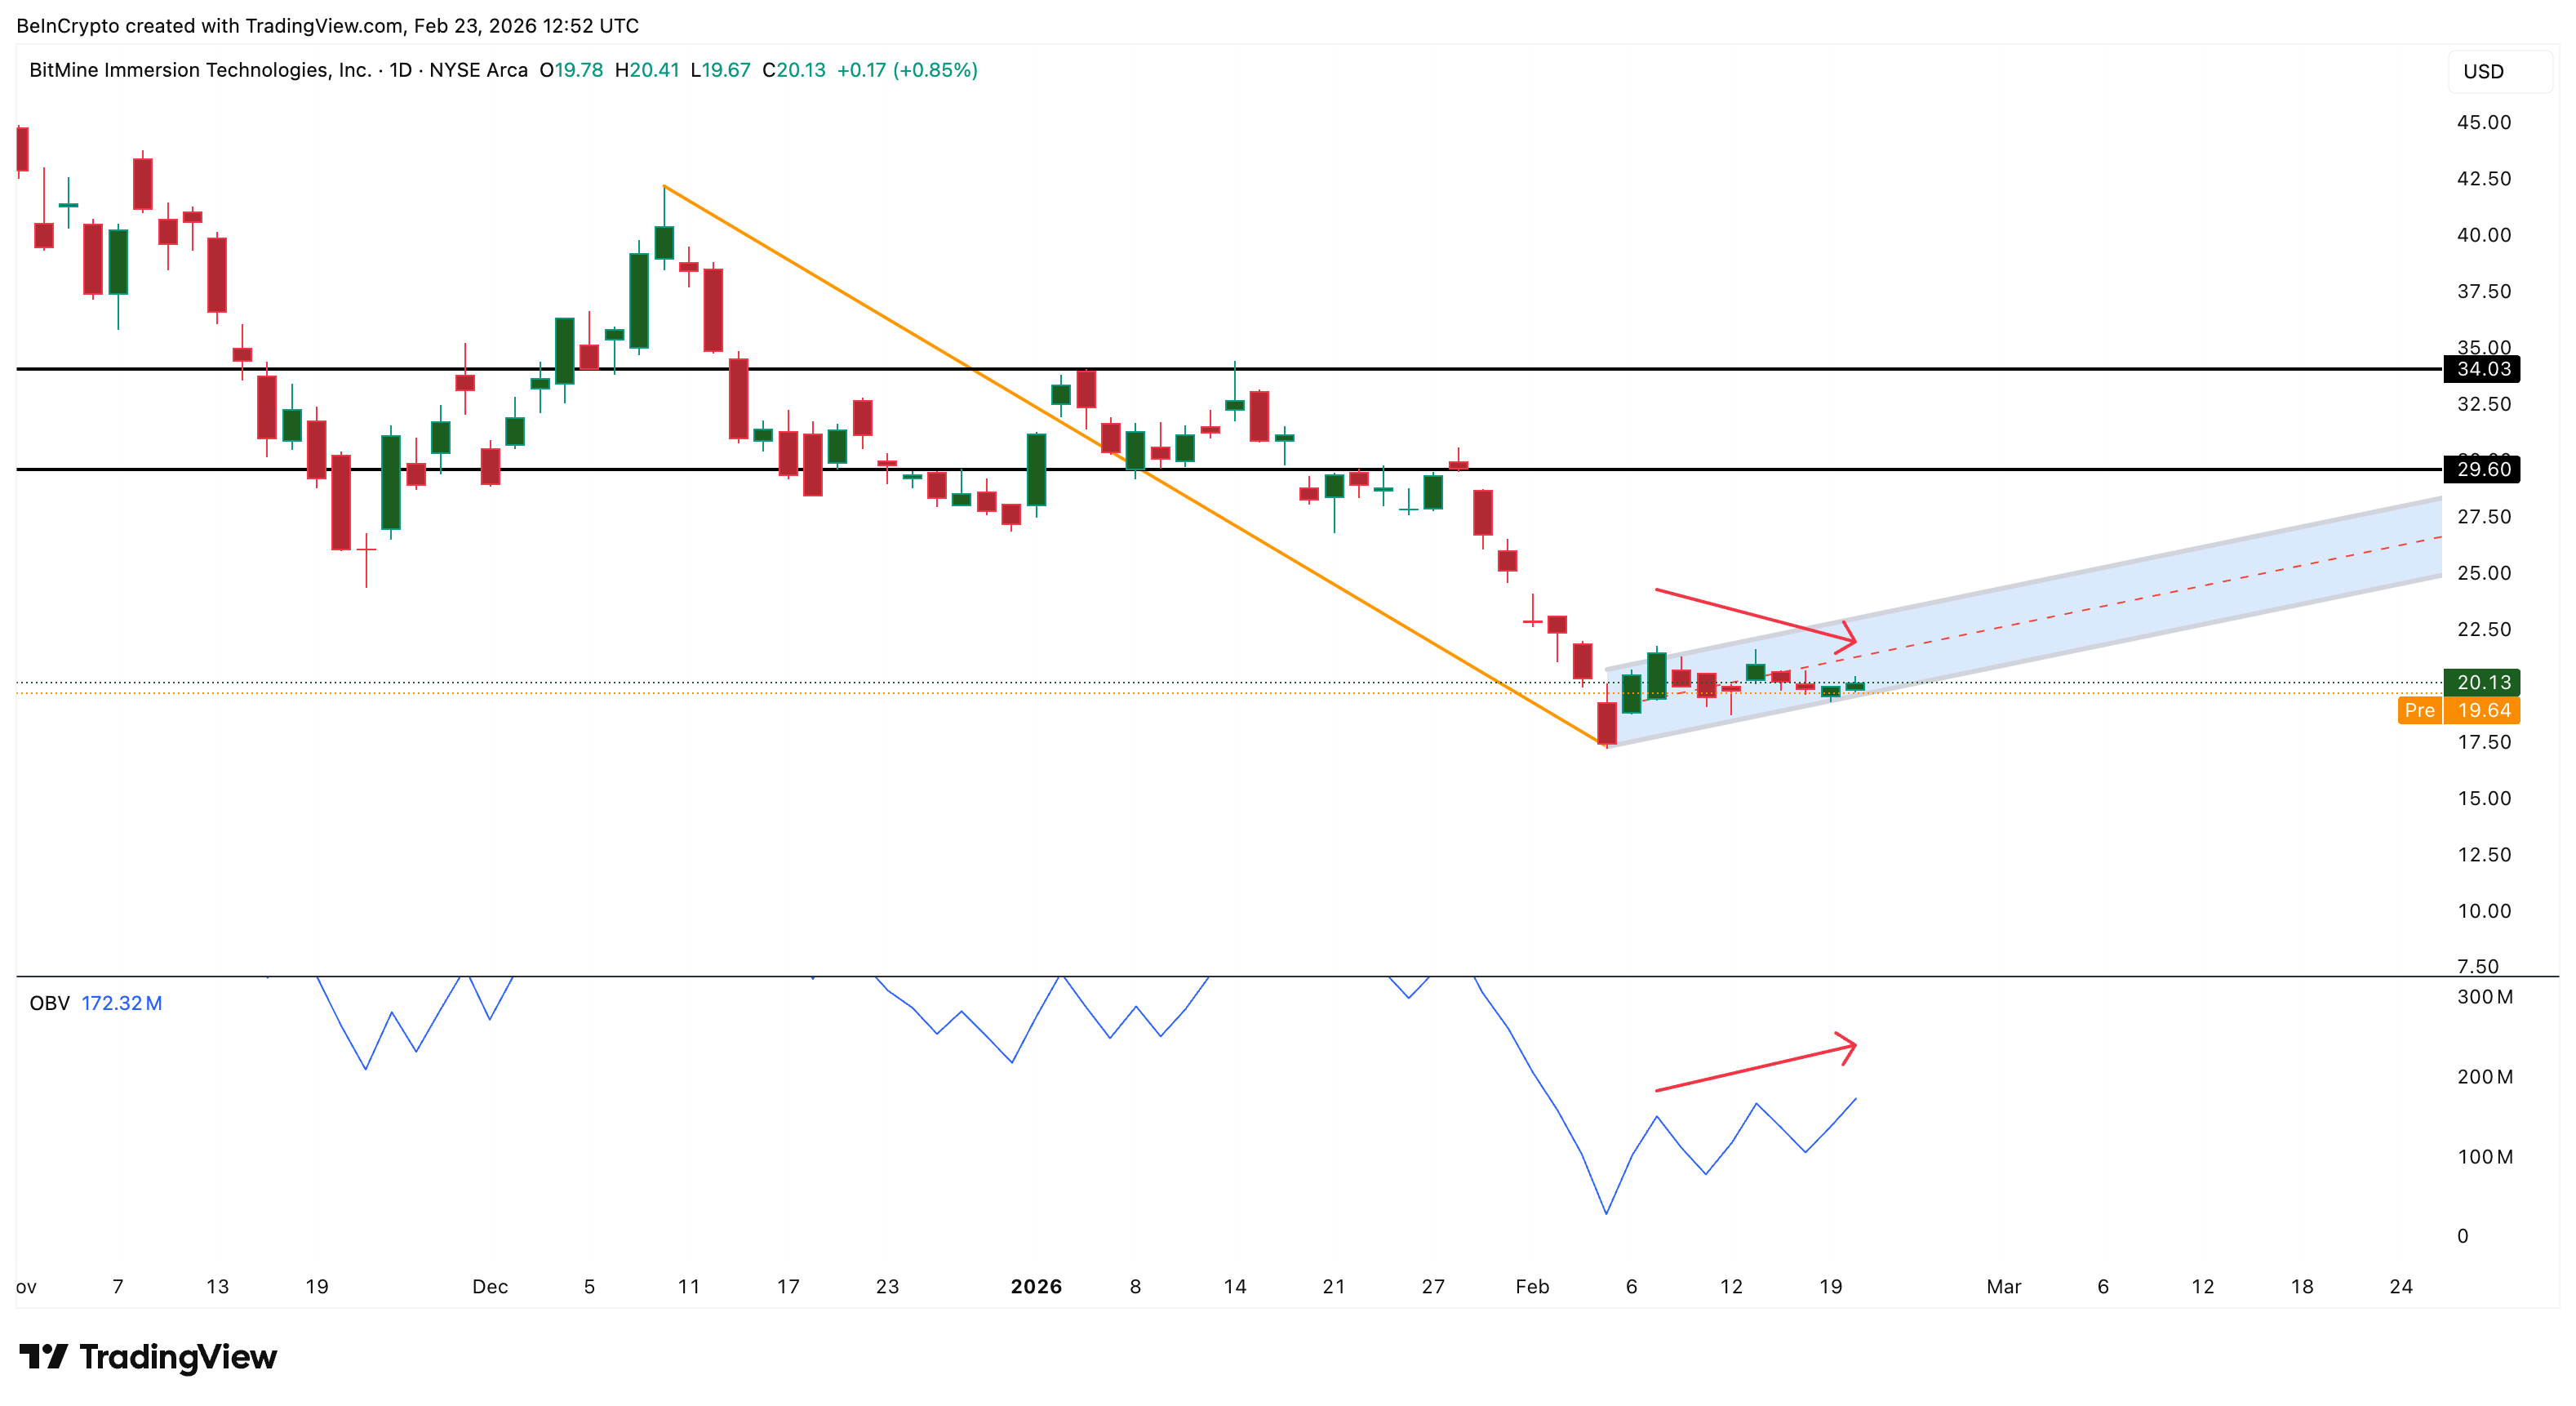
The On-Balance Volume (OBV) indicator, which tracks cumulative buying and selling pressure, has increased despite the Bitcoin price trending downward from February 9th to February 20th. This divergence suggests that individual investors have been accumulating stocks during the downturn.
Momentum indicators show a similar pattern. The Relative Strength Index (RSI), which measures momentum, formed a bullish divergence from November 21, 2025 to February 12, 2026.
While BitMine price made new lows, RSI formed an even higher low. This pattern often indicates that selling pressure is waning.
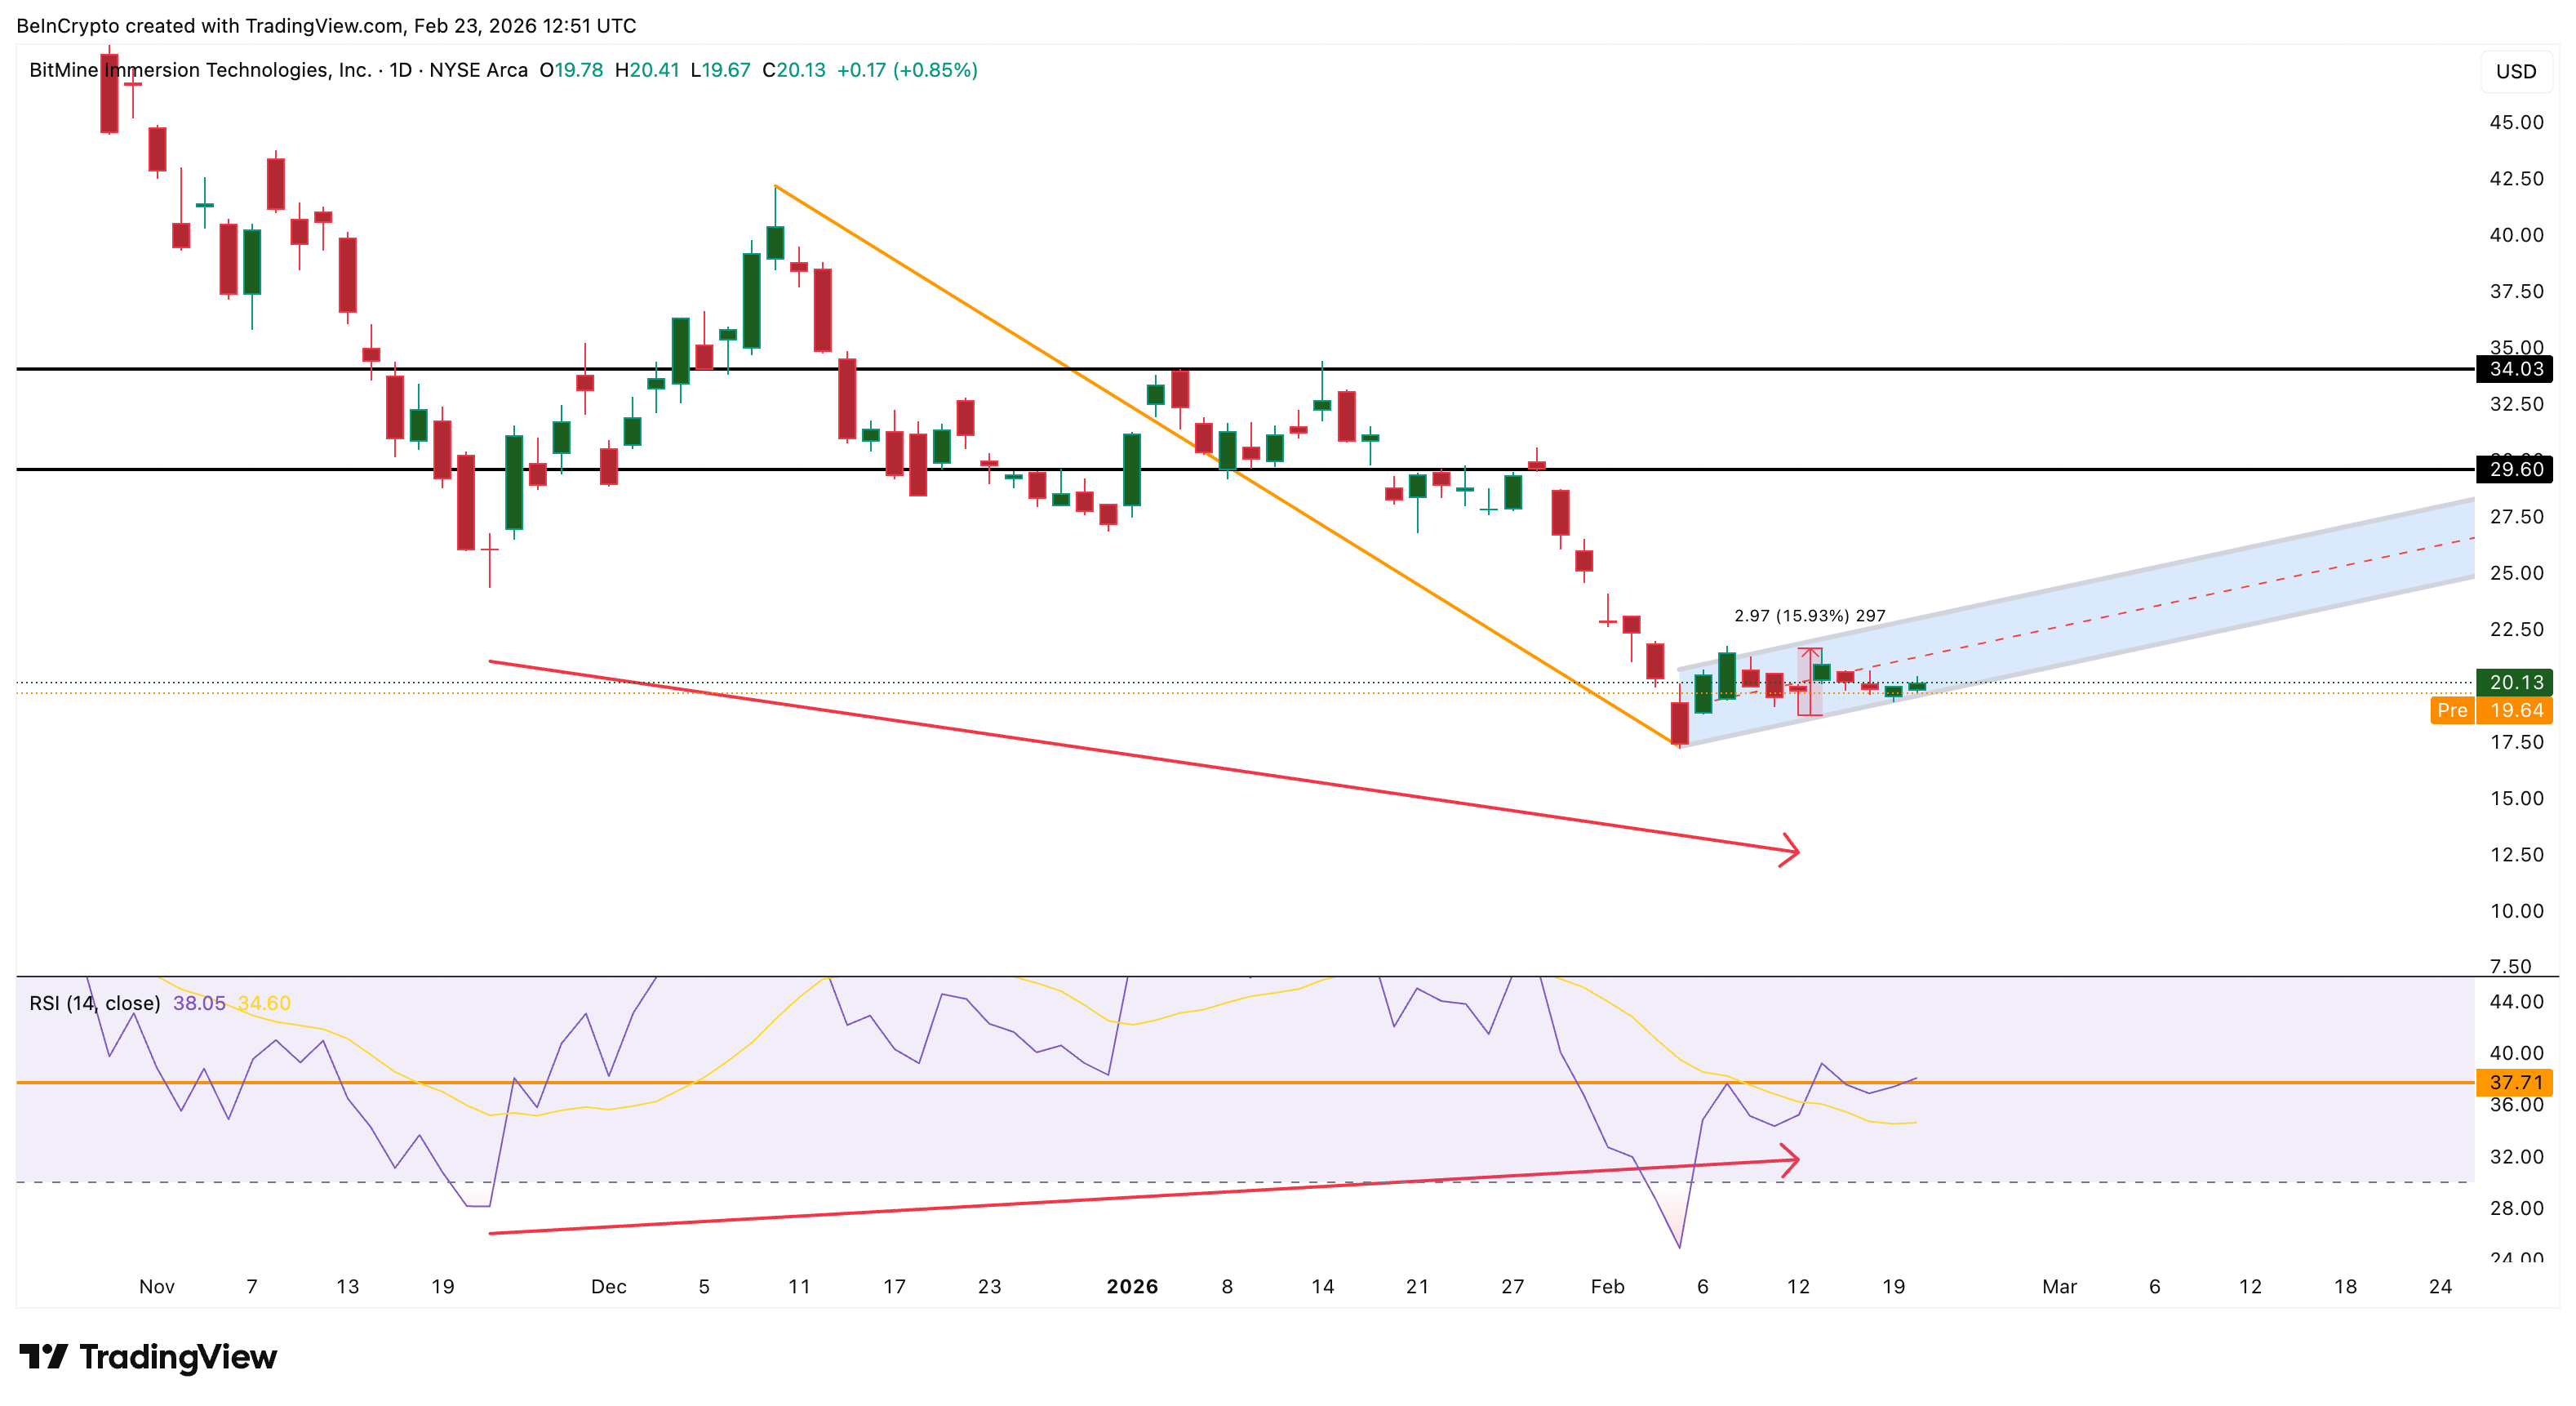
This divergence did indeed cause a nearly 16% rebound earlier, but the recovery stalled and failed to reverse the overall trend. This failure likely reflects BitMine’s heavy reliance on Ethereum. The reason is that BitMine’s large ETH funding makes BitMine stock highly sensitive to continued weakness in Ethereum.
This shows that retail buying alone is not powerful enough to completely change market sentiment. The next move depends entirely on whether key price levels break down.
Important BitMine stock levels to track right now
BitMine stock is currently at a critical technological crossroads.
The first significant resistance level is $21.76. Above this level, the stock will rise above VWAP and indicate improving strength. This could suggest that institutional investors are starting to return.
However, unless BitMine breaks above $30.52, the broader bearish structure remains active and the bearish flag pattern could weaken. On the downside, the most important support level lies at $18.60.
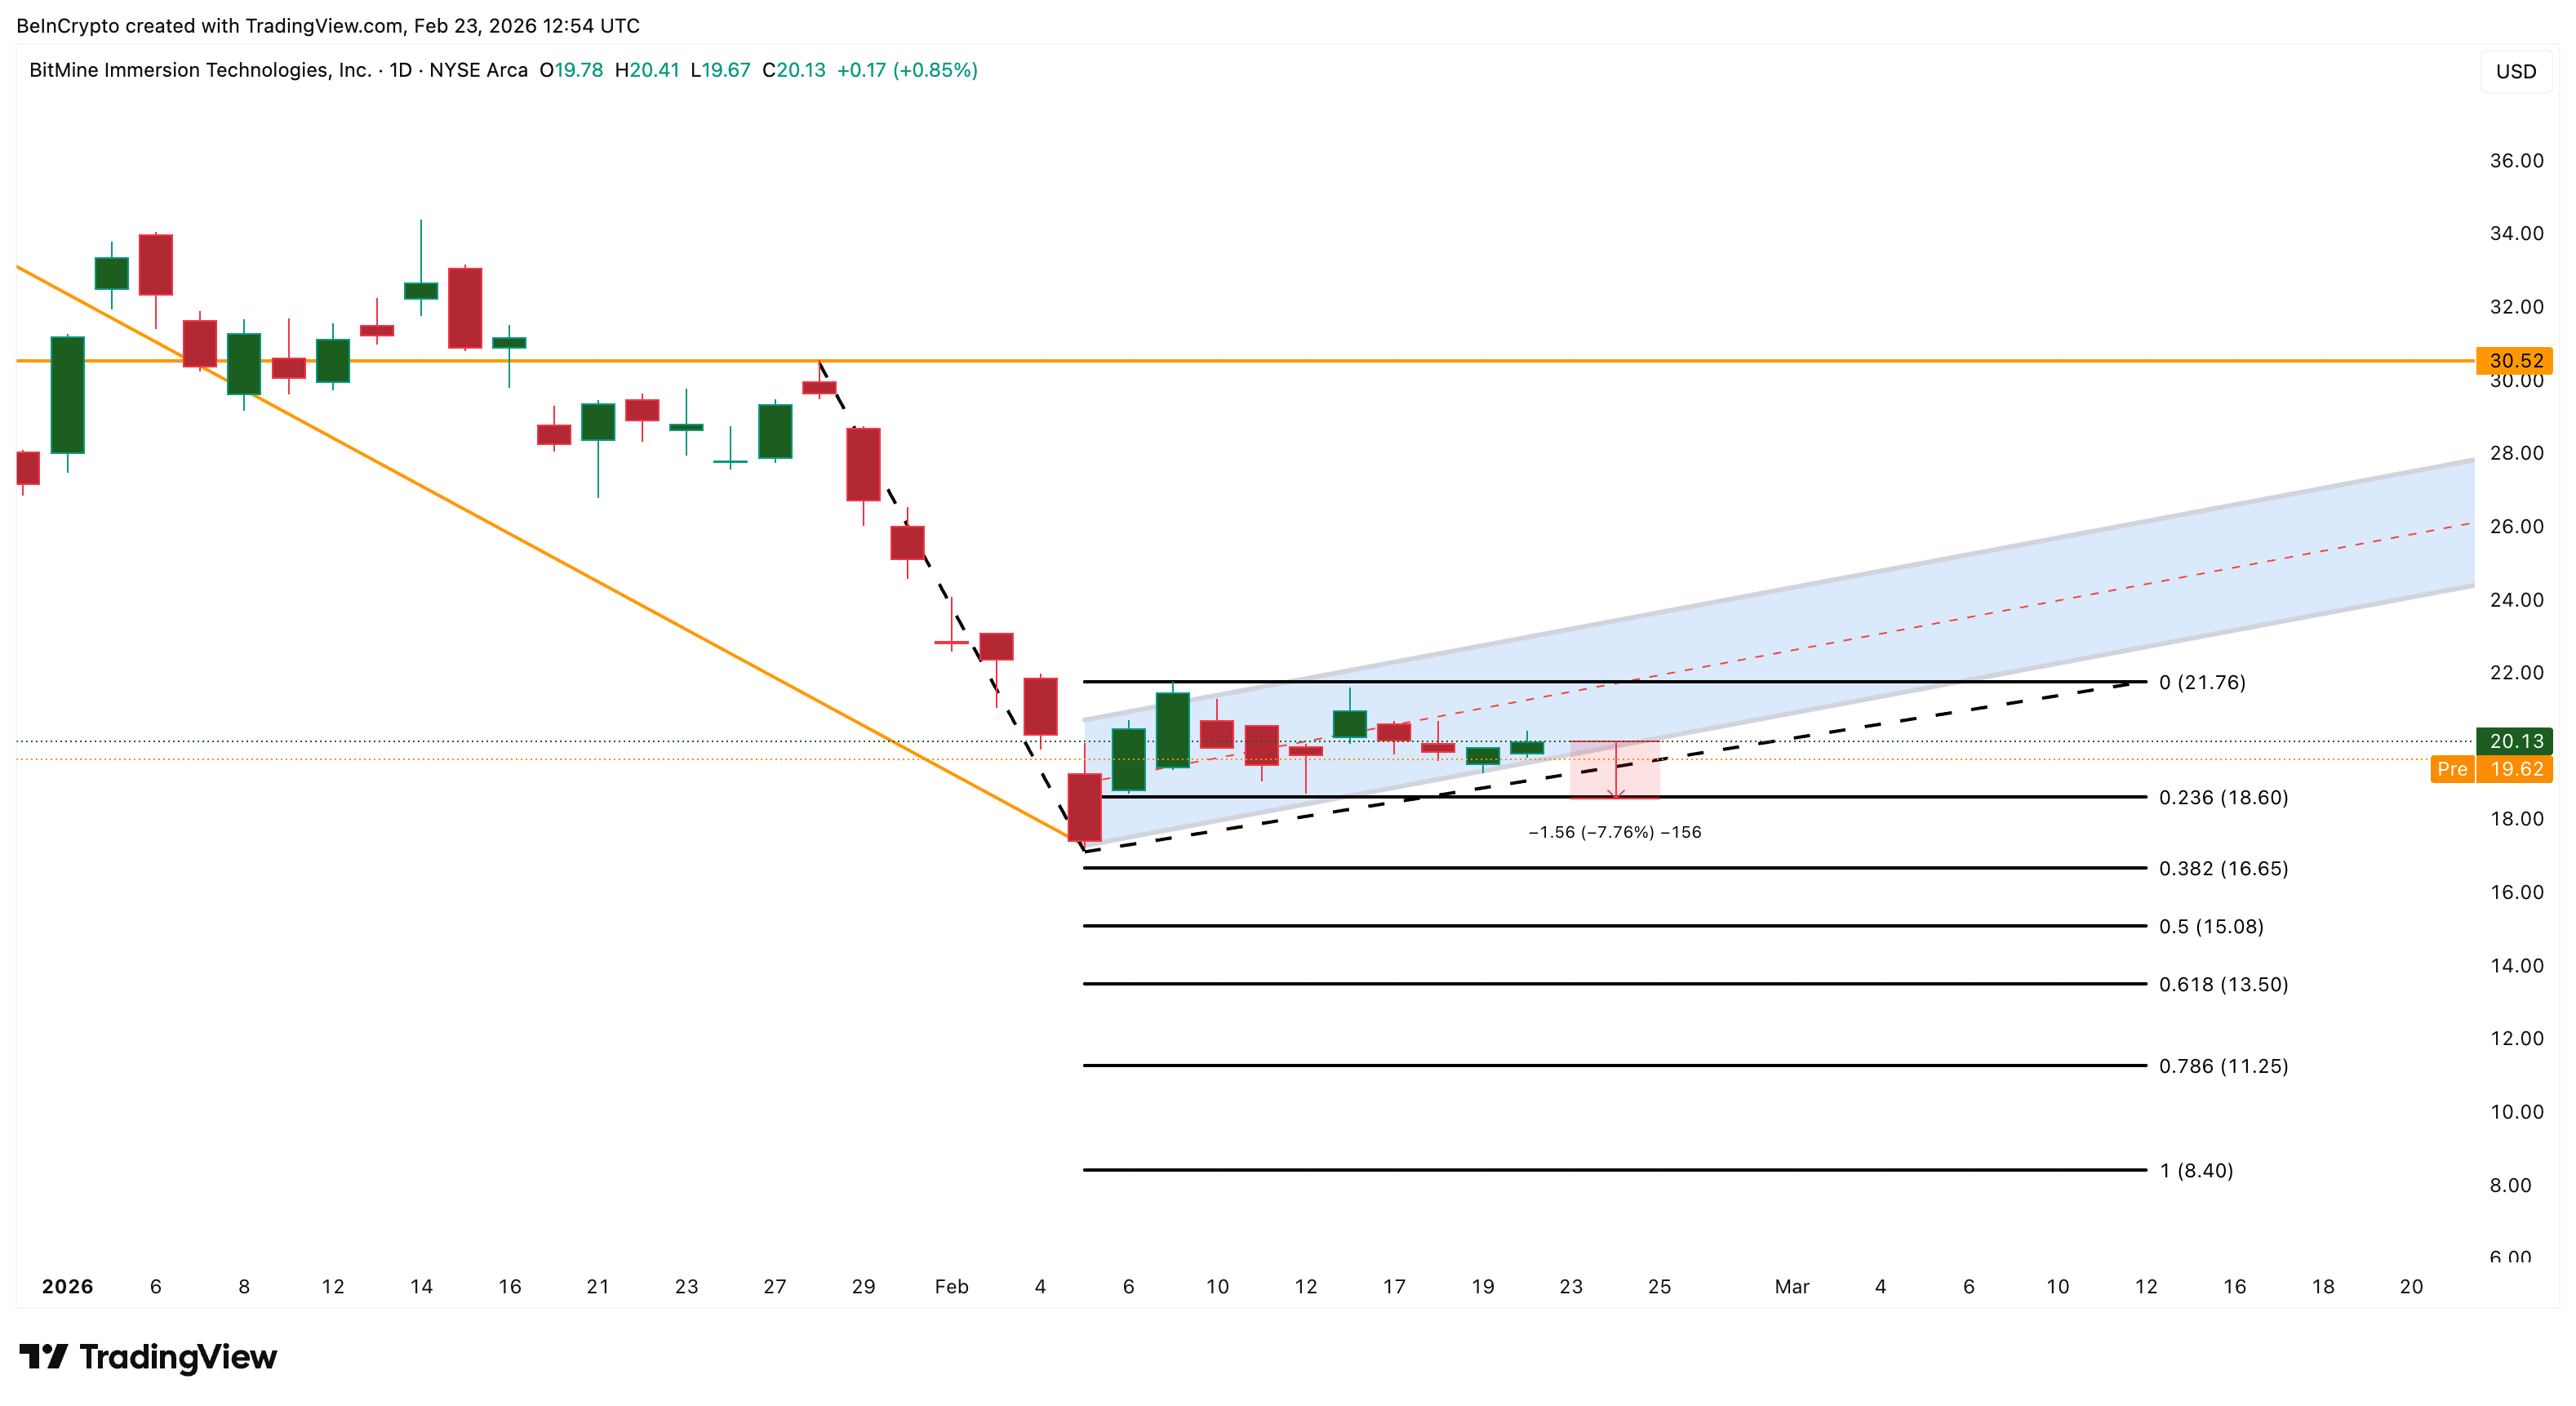
If BitMine breaks below this level, the bearish structure will strengthen significantly. With a decline in the RSI, a break below $18.60 could result in the formation of a new local bottom, weakening the current bullish divergence structure. Furthermore, it would confirm Bear Flag’s failure.
This could pave the way for $15.08, but if the selling accelerates, it could further increase the downside risk to $11.25.
BitMine’s Ethereum accumulation shows long-term confidence. But the stock remains likely to fall again until institutional buyers return and key resistance breaks.