

XRP price remains within the constraints of a descending parallel channel, a bearish technical formation that began around mid-July.
However, the token that powers the Ripple ecosystem has managed to buck the trend as crypto asset outflows reached $446 million last week.
sponsored
XRP bucks the trend as crypto outflows reach $446 million
According to CoinShares’ latest report, crypto outflows last week reached $446 million, slightly lower than the $952 million in negative outflows seen in the week ending December 20th.
However, in both weeks, XRP managed to buck the trend and receive positive capital flows while major assets such as Bitcoin and Ethereum experienced red flashes.
After recording positive flows of $62.9 million in the week before Christmas, positive flows to XRP reached $70.2 million last week. Meanwhile, Bitcoin and Ethereum recorded negative flows of $443 million and $59.3 million, respectively.
“This suggests that investor sentiment has not yet fully recovered…XRP and Solana each recorded the largest inflows last week, totaling $70.2 million and $7.5 million, respectively,” reads an excerpt from CoinShares’ latest report.
sponsored
James Butterfill, head of research at CoinShares, attributes the positive sentiment seen in XRP and Solana to the launch of their respective ETFs in mid-October.
“Since the ETF’s launch in the US in mid-October, it has seen inflows of $1.07 billion and $1.34 billion, respectively, offsetting the negative sentiment seen in other assets,” Butterfill added.
In fact, as reported by BeInCrypto, the XRP ETF has maintained a continuous positive flow, likely contributing to the $70 million witnessed last week.
sponsored
Technical pressures increase as XRP price settles into bearish pattern
Despite positive inflows into XRP-related funds, Ripple price is still trapped in a bearish technical formation, waiting for a bearish hand to impact the price during a gradual recovery. On-chain data and charts tell a different story.
As long as XRP price remains within the channel, its value is likely to continue its downward trend. A close below the support at $1.77 could open the floor to $1.50, almost 20% below current levels.
If more bearish than bullish hands are waiting to interact with the price during a slight recovery, how can we avoid such a fate? The bearish volume profile (red horizontal bars) indicates the seller’s position, and the green horizontal bar indicates the buyer’s position.
The Relative Strength Index (RSI), a momentum indicator, is below 50, indicating an advantage for sellers. This highlights a correction phase, flattening out after an extended period of decline, and typically indicates a compression of momentum.
sponsored
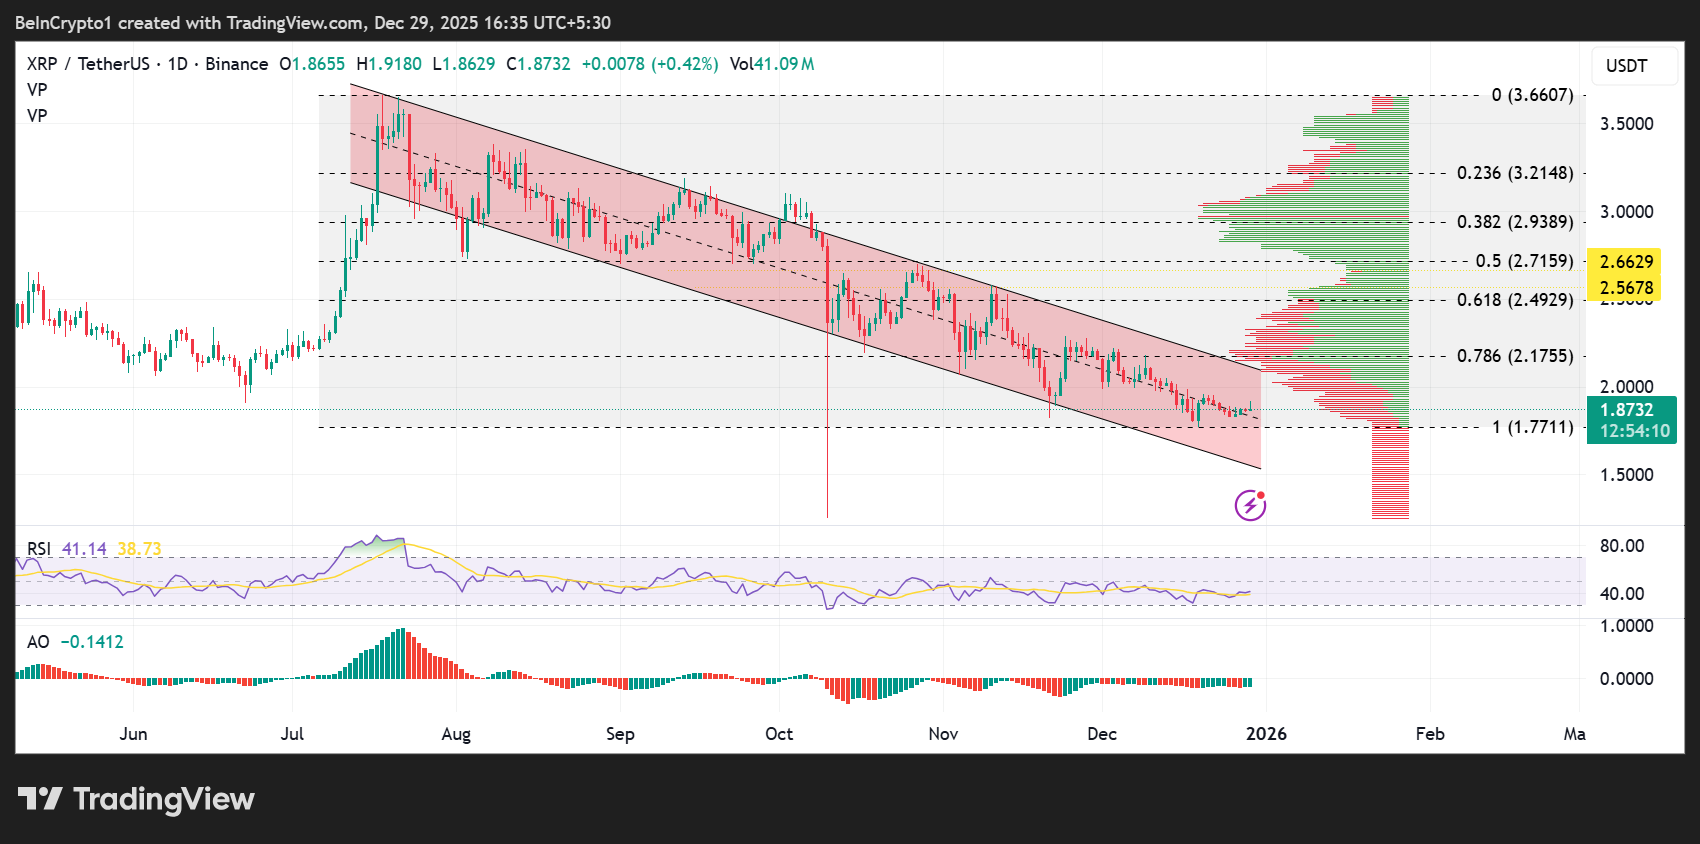
Meanwhile, Awesome Oscillator is flashing green but still in negative territory. This means that although the bears are losing their aggressiveness, the bulls are not decisively intervening.
Each small rebound in RSI does not break below the midline relative to the upper bound of the descending parallel channel, indicating that the trend is intact.
So what could change the situation for XRP price? If the RSI rises cleanly above 50, we will first see a change in trend, especially in parallel with an upward breakout of the channel.
Buyers should break and wait for a successful retest of the price above the upper trendline of the channel. Until then, Larry is technically a relief bound.