

Ethereum price has fallen into a tense zone after a weak start in January. ETH has fallen by just under 1% in the past 24 hours, and its 30-day decline has now widened to around 3.6%. At the same time, prices remain well above key long-term supports, and traders are split on direction.
What makes this setting difficult is the balance of risk. Ethereum is trading within a bearish chart pattern, but positioning data suggests that the downside may not be as simple as it seems.
Is Ethereum trading within a bearish pattern?
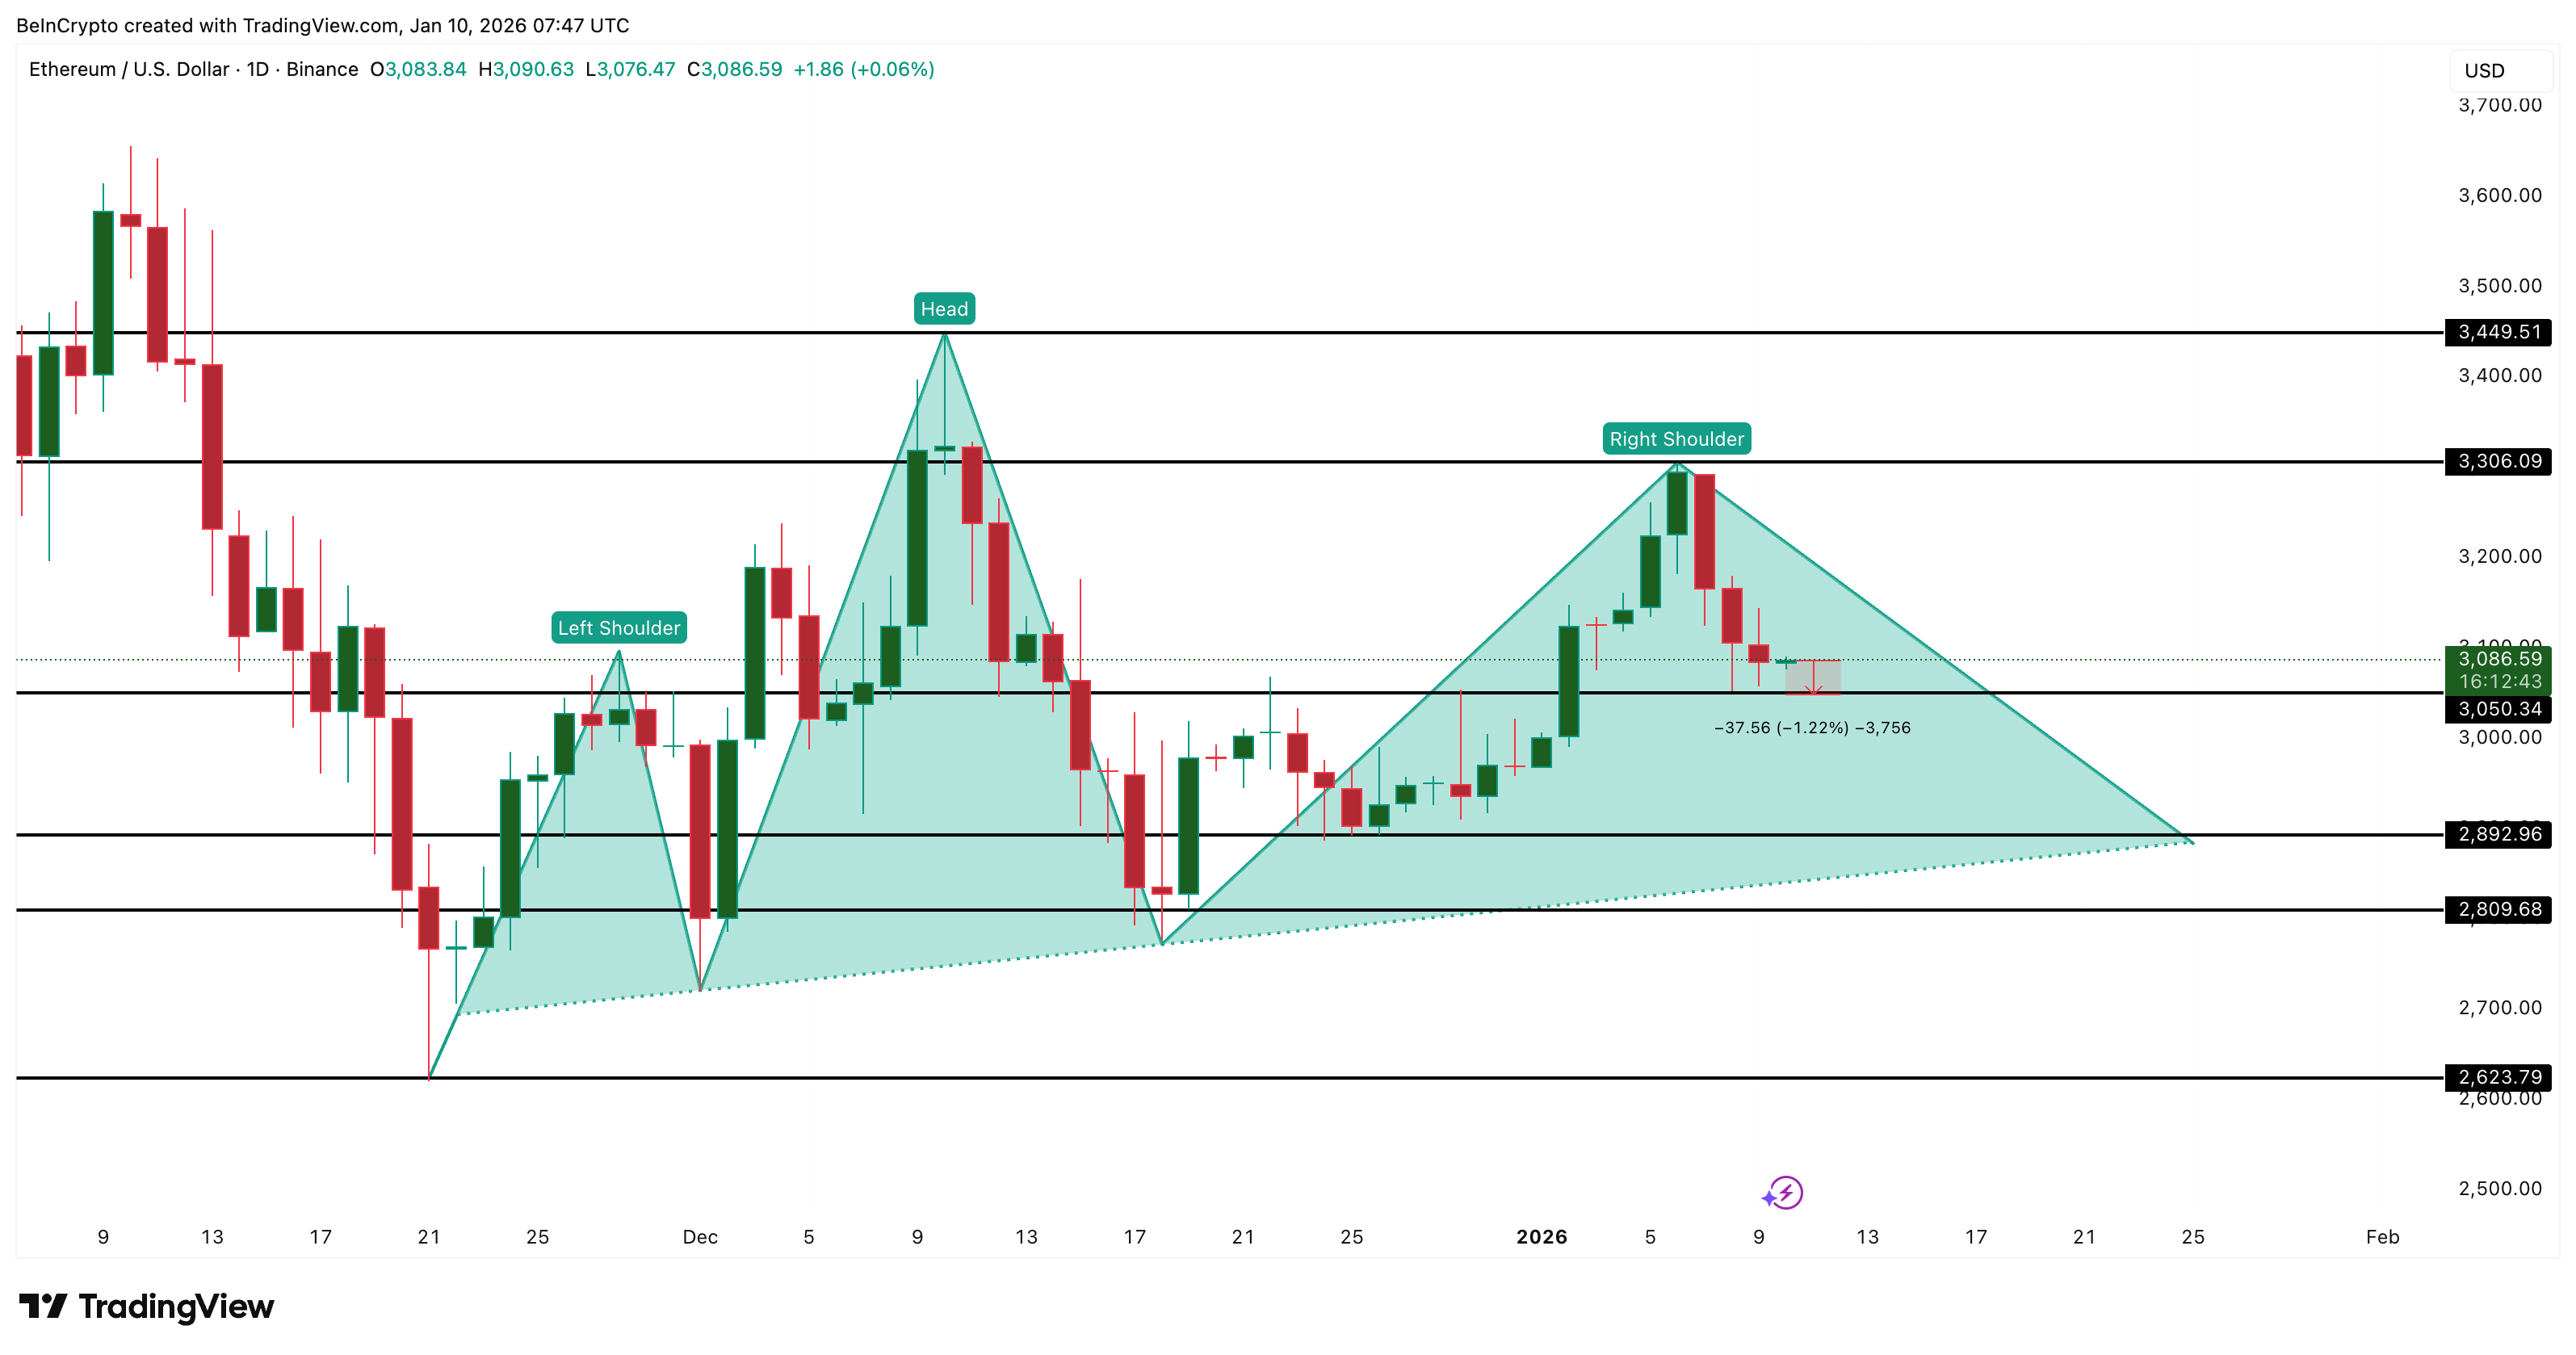
On the daily chart, Ethereum is forming a head and shoulders pattern. This is a bearish structure in which price forms a left shoulder, a higher peak called the head, and a lower right shoulder. A break below the neckline will confirm the downside.
Sponsored Sponsored
In the case of Ethereum, a daily close below the neckline requires a downside price movement of approximately 9%. Conversely, moving about 12% higher will completely invalidate the pattern.
Want more token insights like this? Sign up for Editor Harsh Notariya’s Daily Crypto Newsletter here.
Momentum is not helping the bulls yet. The Relative Strength Index (RSI) measures price momentum. A hidden bearish divergence indicates a weakening of the strength of the trend when RSI forms higher highs and price forms lower highs. That’s exactly what happened from early December to early January.
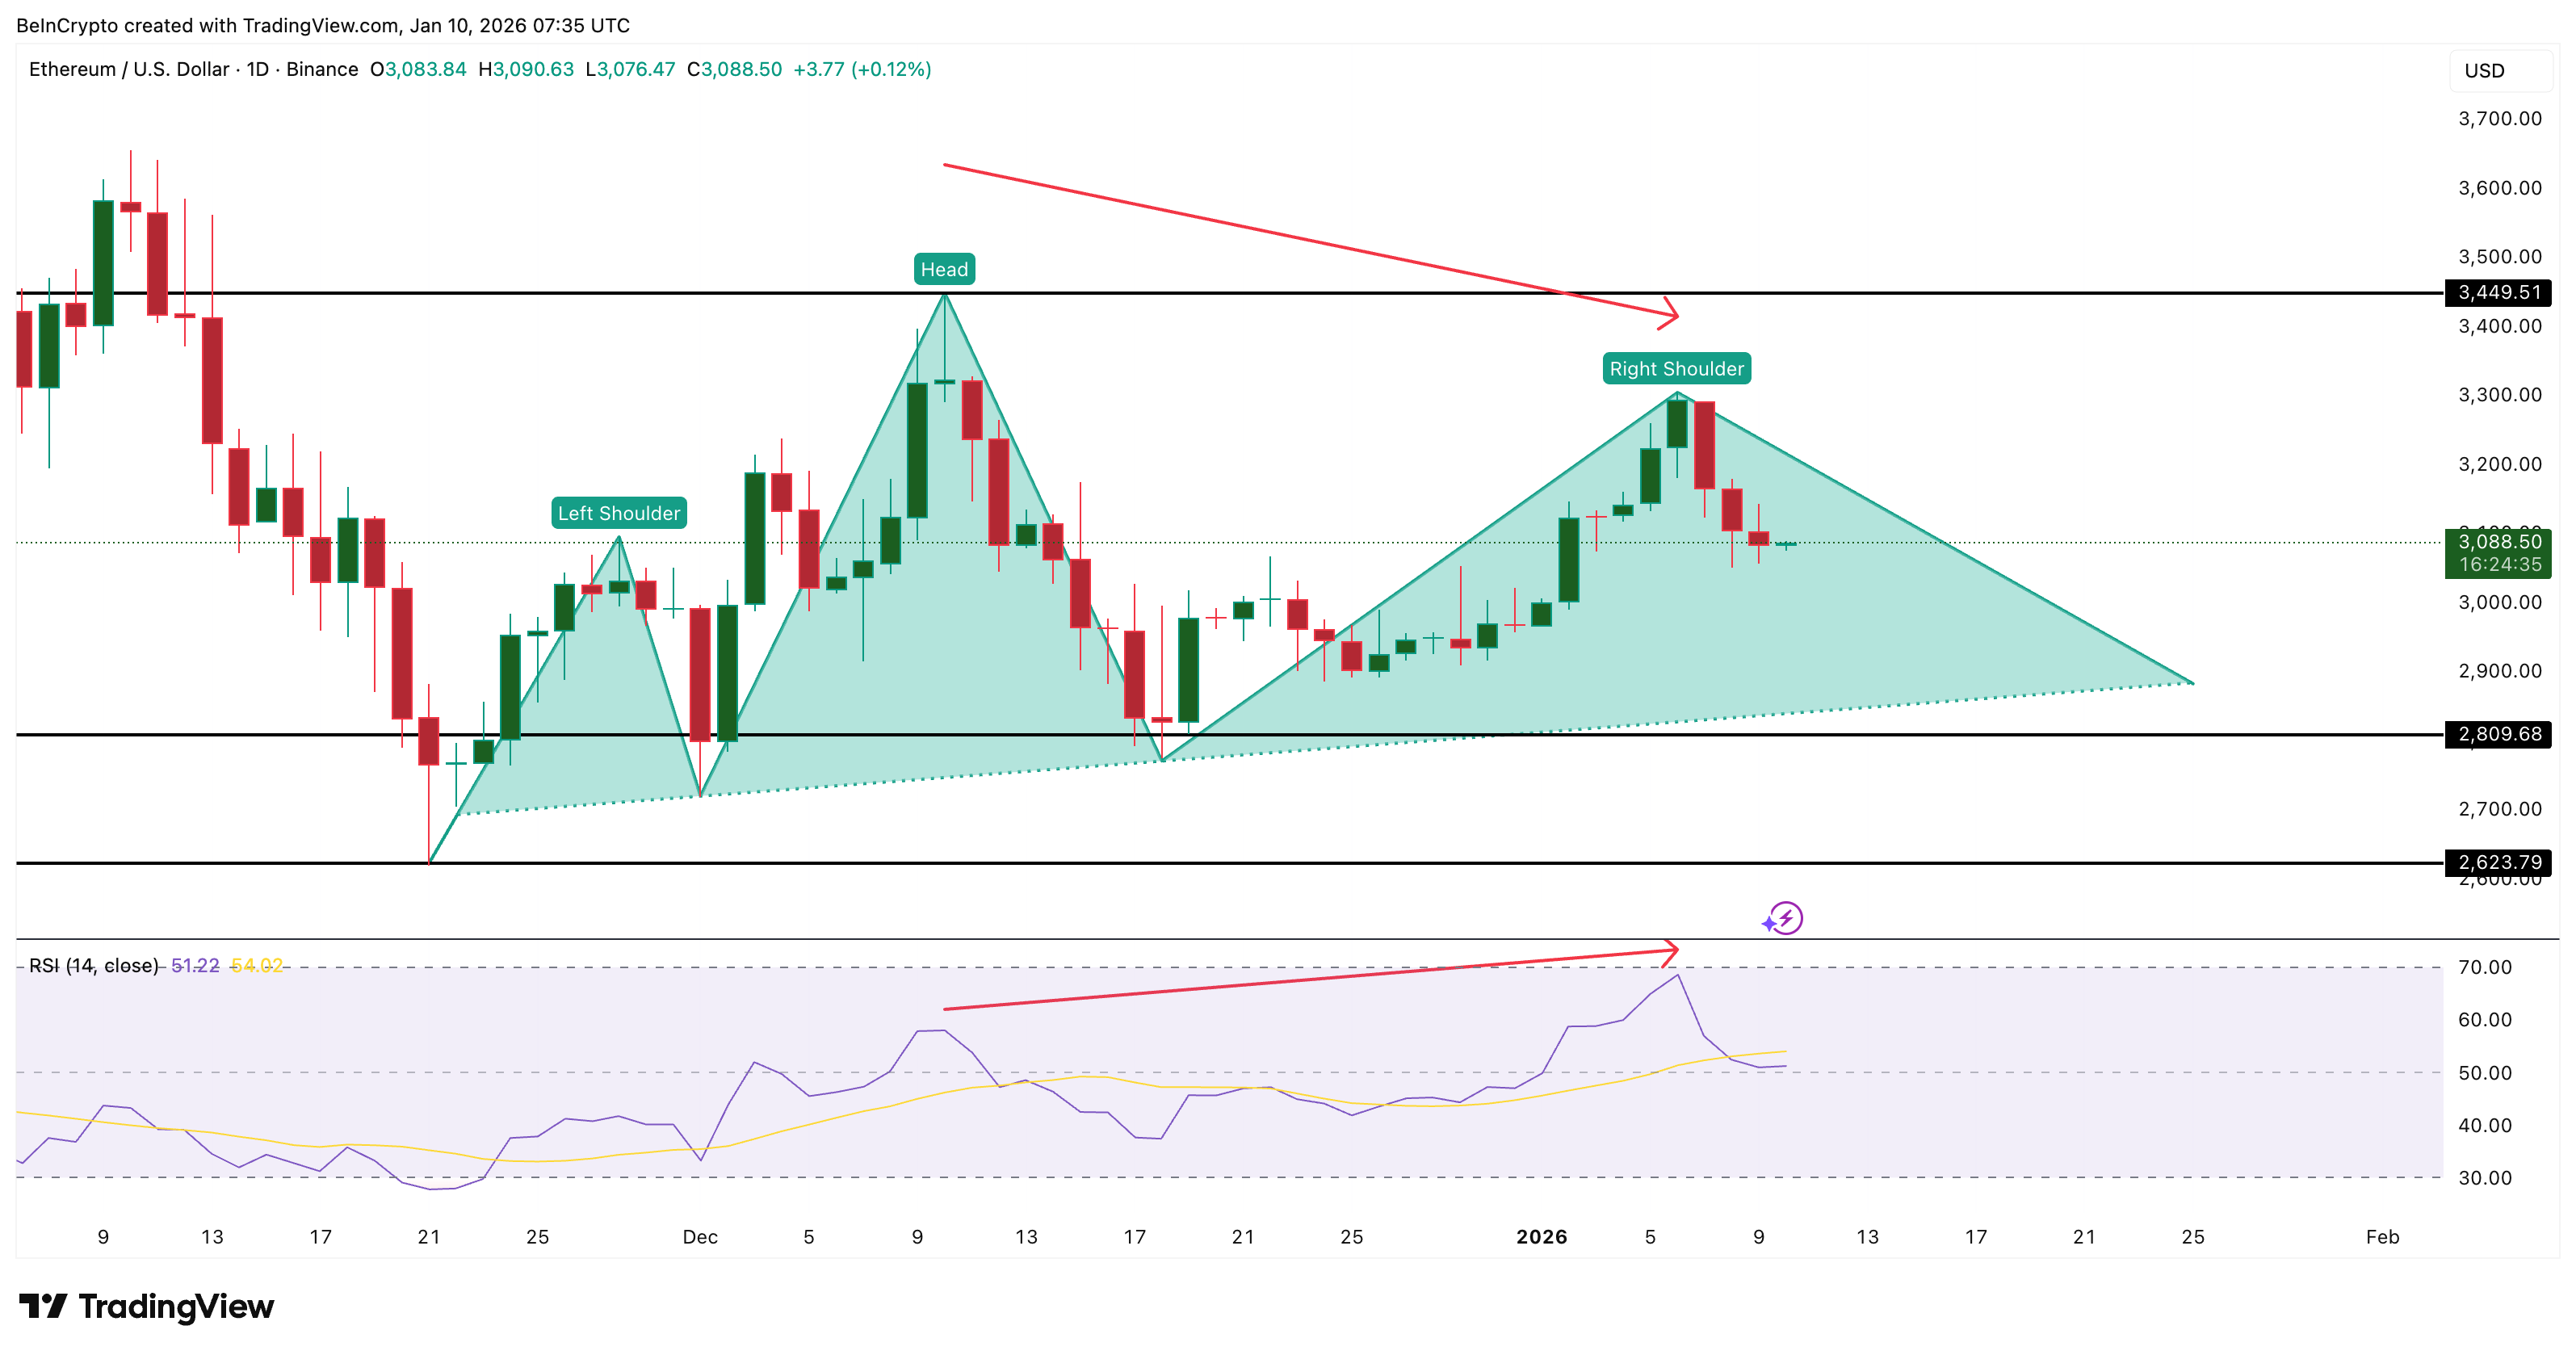
Since then, the price has returned and no bullish break has formed. This leaves the risk of failure active rather than resolved.
Therefore, Ethereum remains structurally weak. However, structure alone does not explain everything. The next question is where the selling pressure will come from.
Short-term selling increases as holder actions weaken support
On-chain data helps identify who is selling and who is not.
Sponsored Sponsored
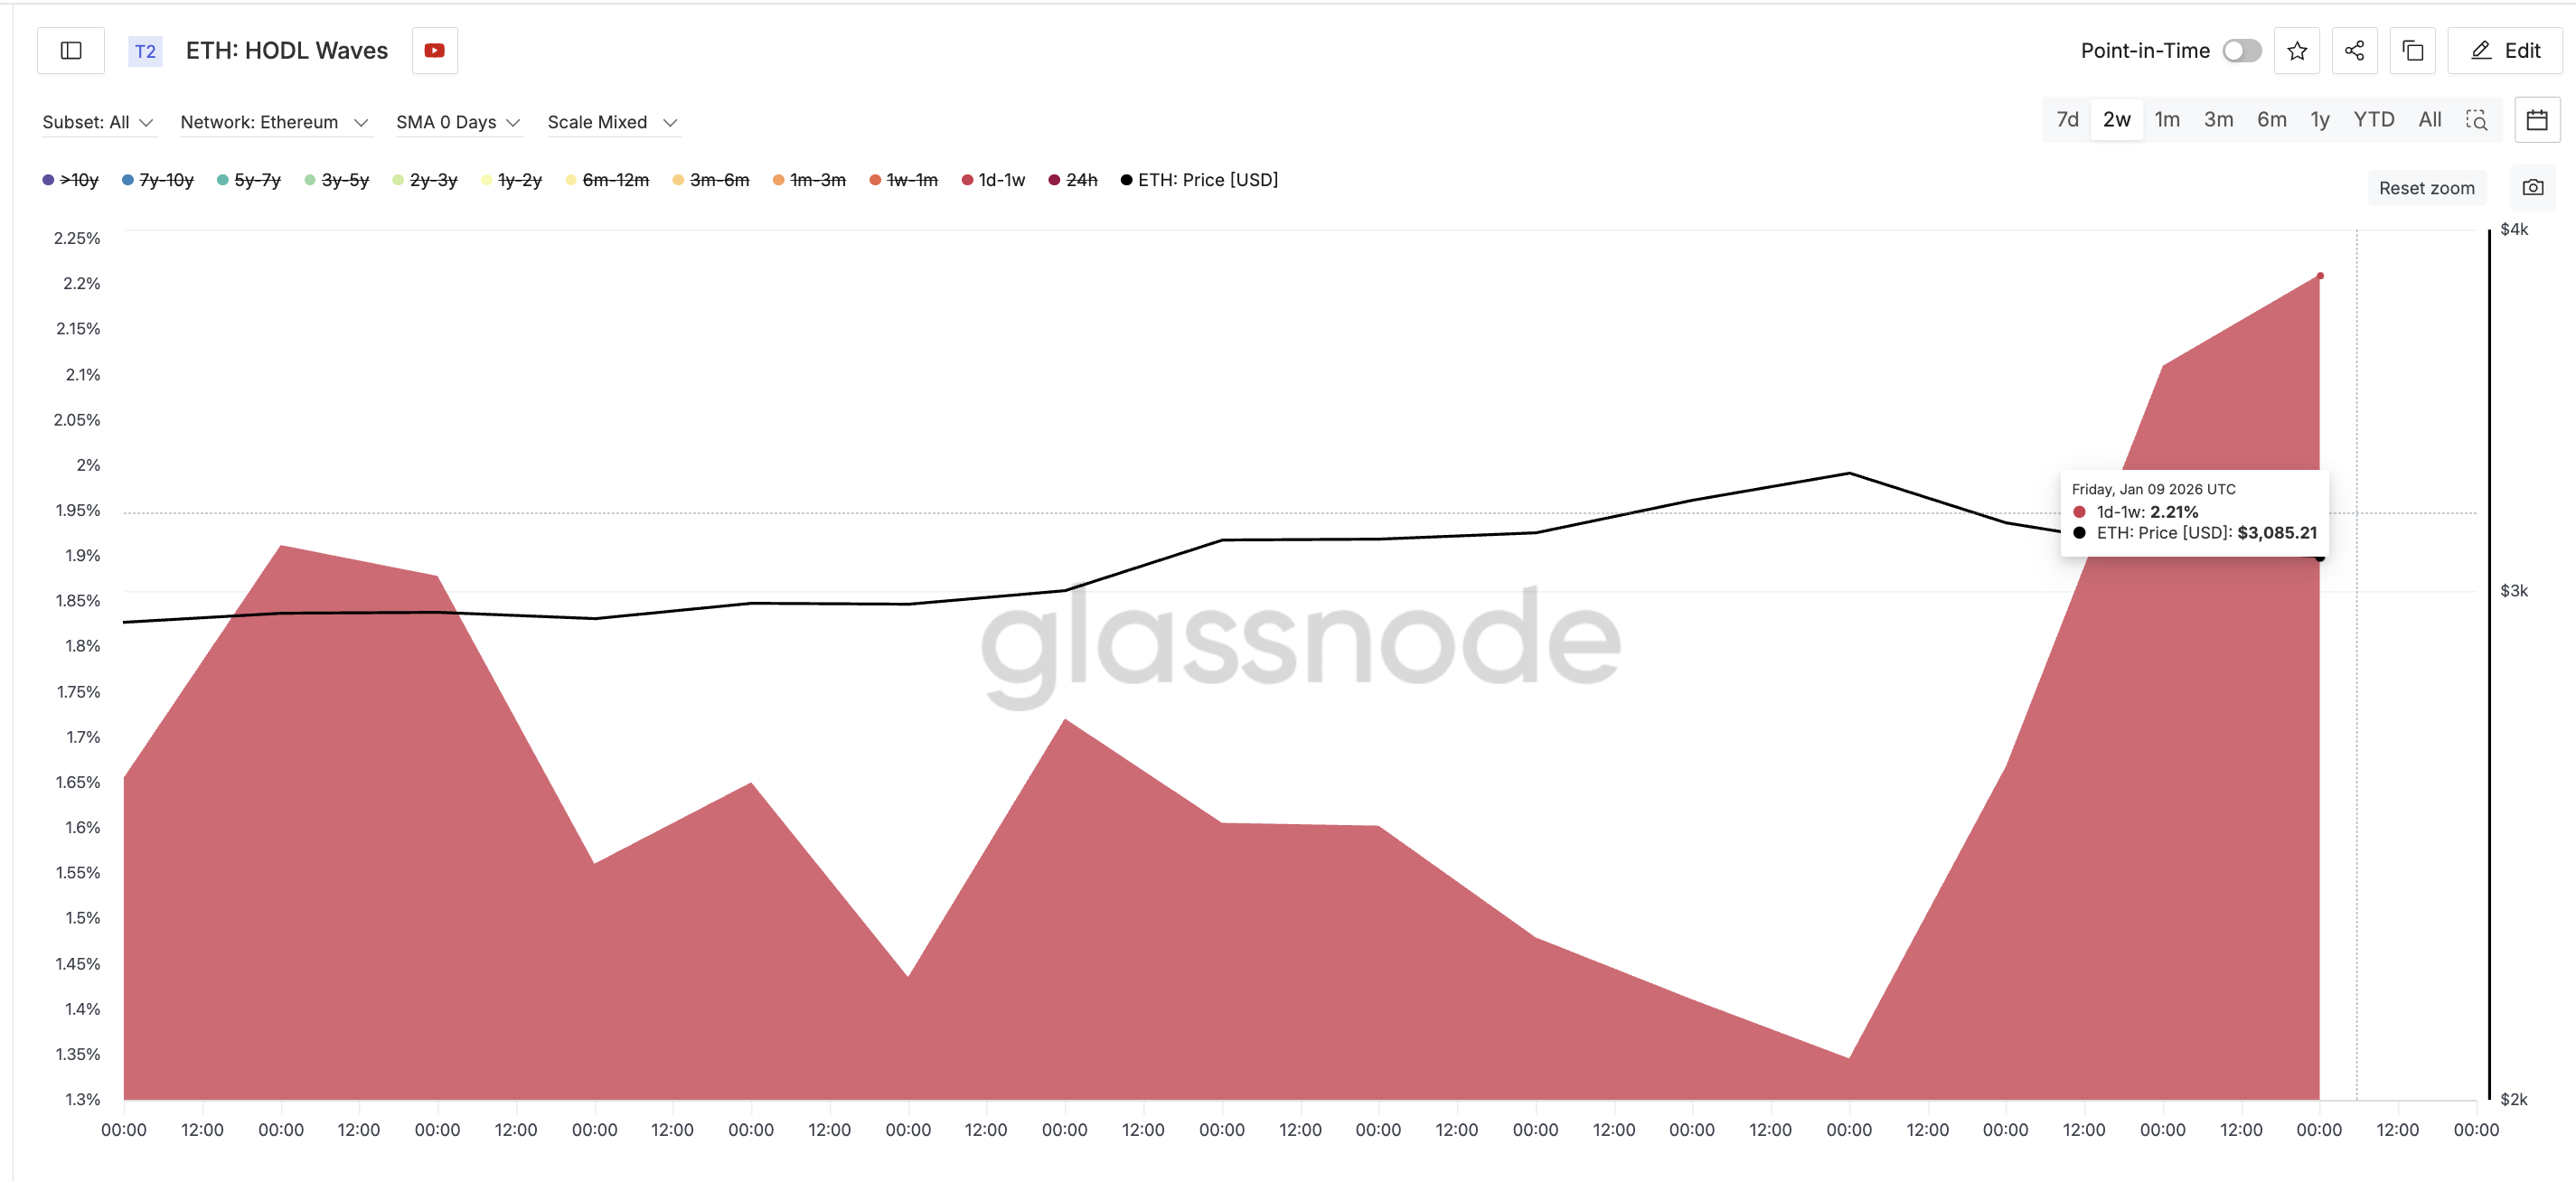
First up is HODL Waves. This indicator categorizes Ethereum supply into groups based on how long the coin has been held. Shorter holding periods typically represent speculative funds, while longer holding periods reflect conviction.
From January 6th to January 9th, the supply share for the 1-week to 1-month cohort fell sharply from 7.44% to 3.92%. This is a 47% decrease, which helps explain much of the recent slump in ETH prices.
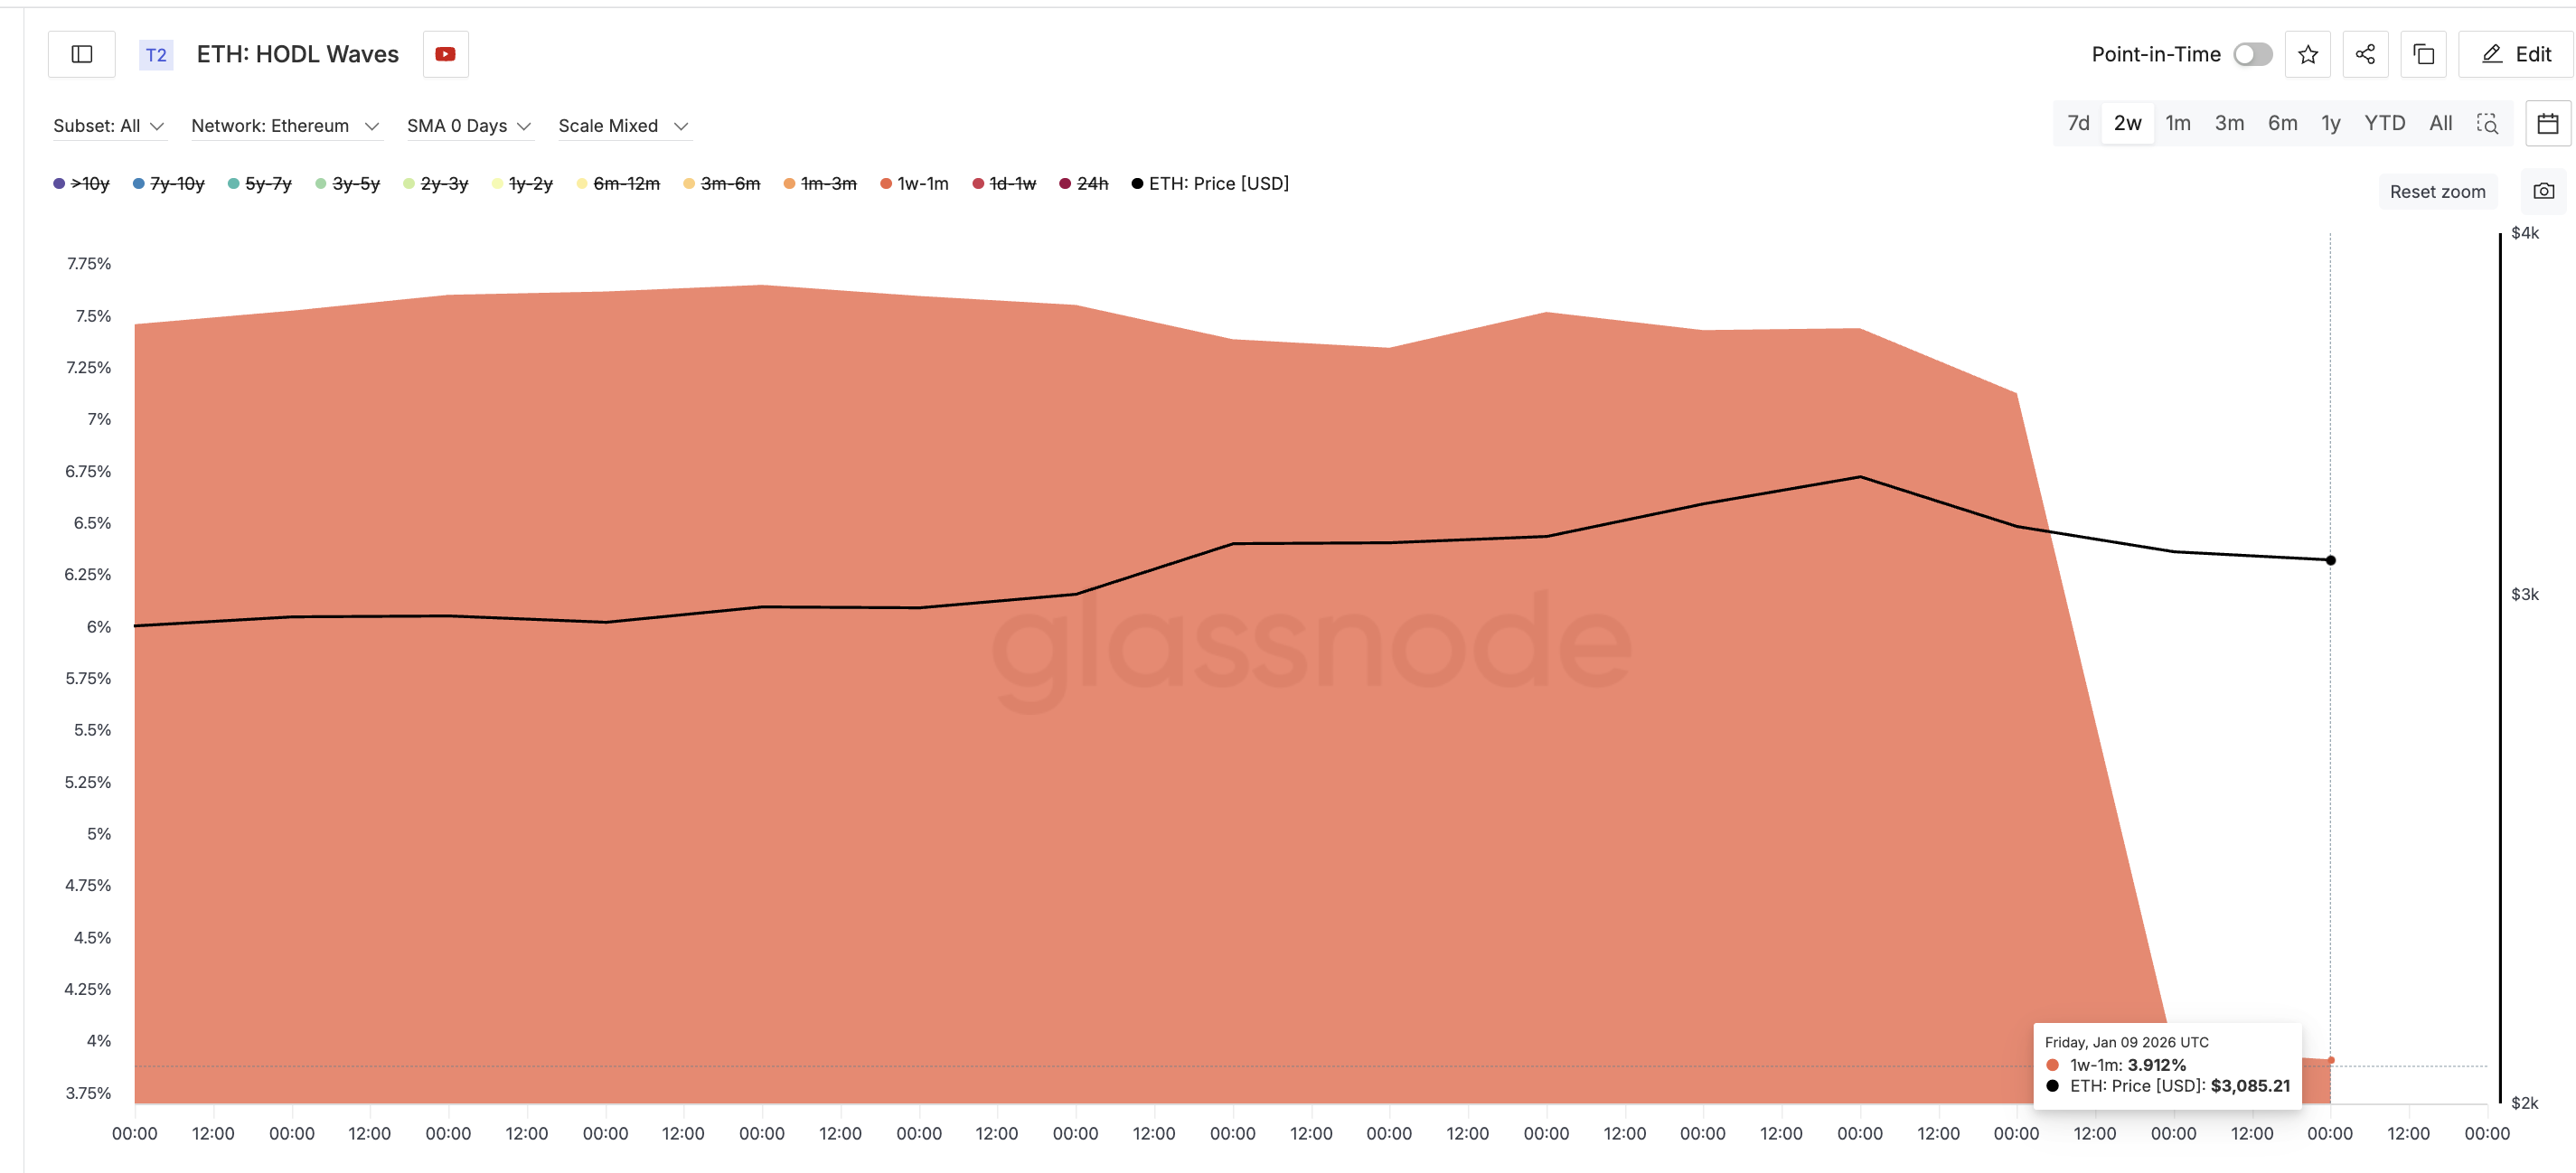
At the same time, the share of the 1-day to 1-week cohort increased from 1.34% to 2.21%, an increase of 65%. This is important because this group often sells quickly when there is even a slight change in price.
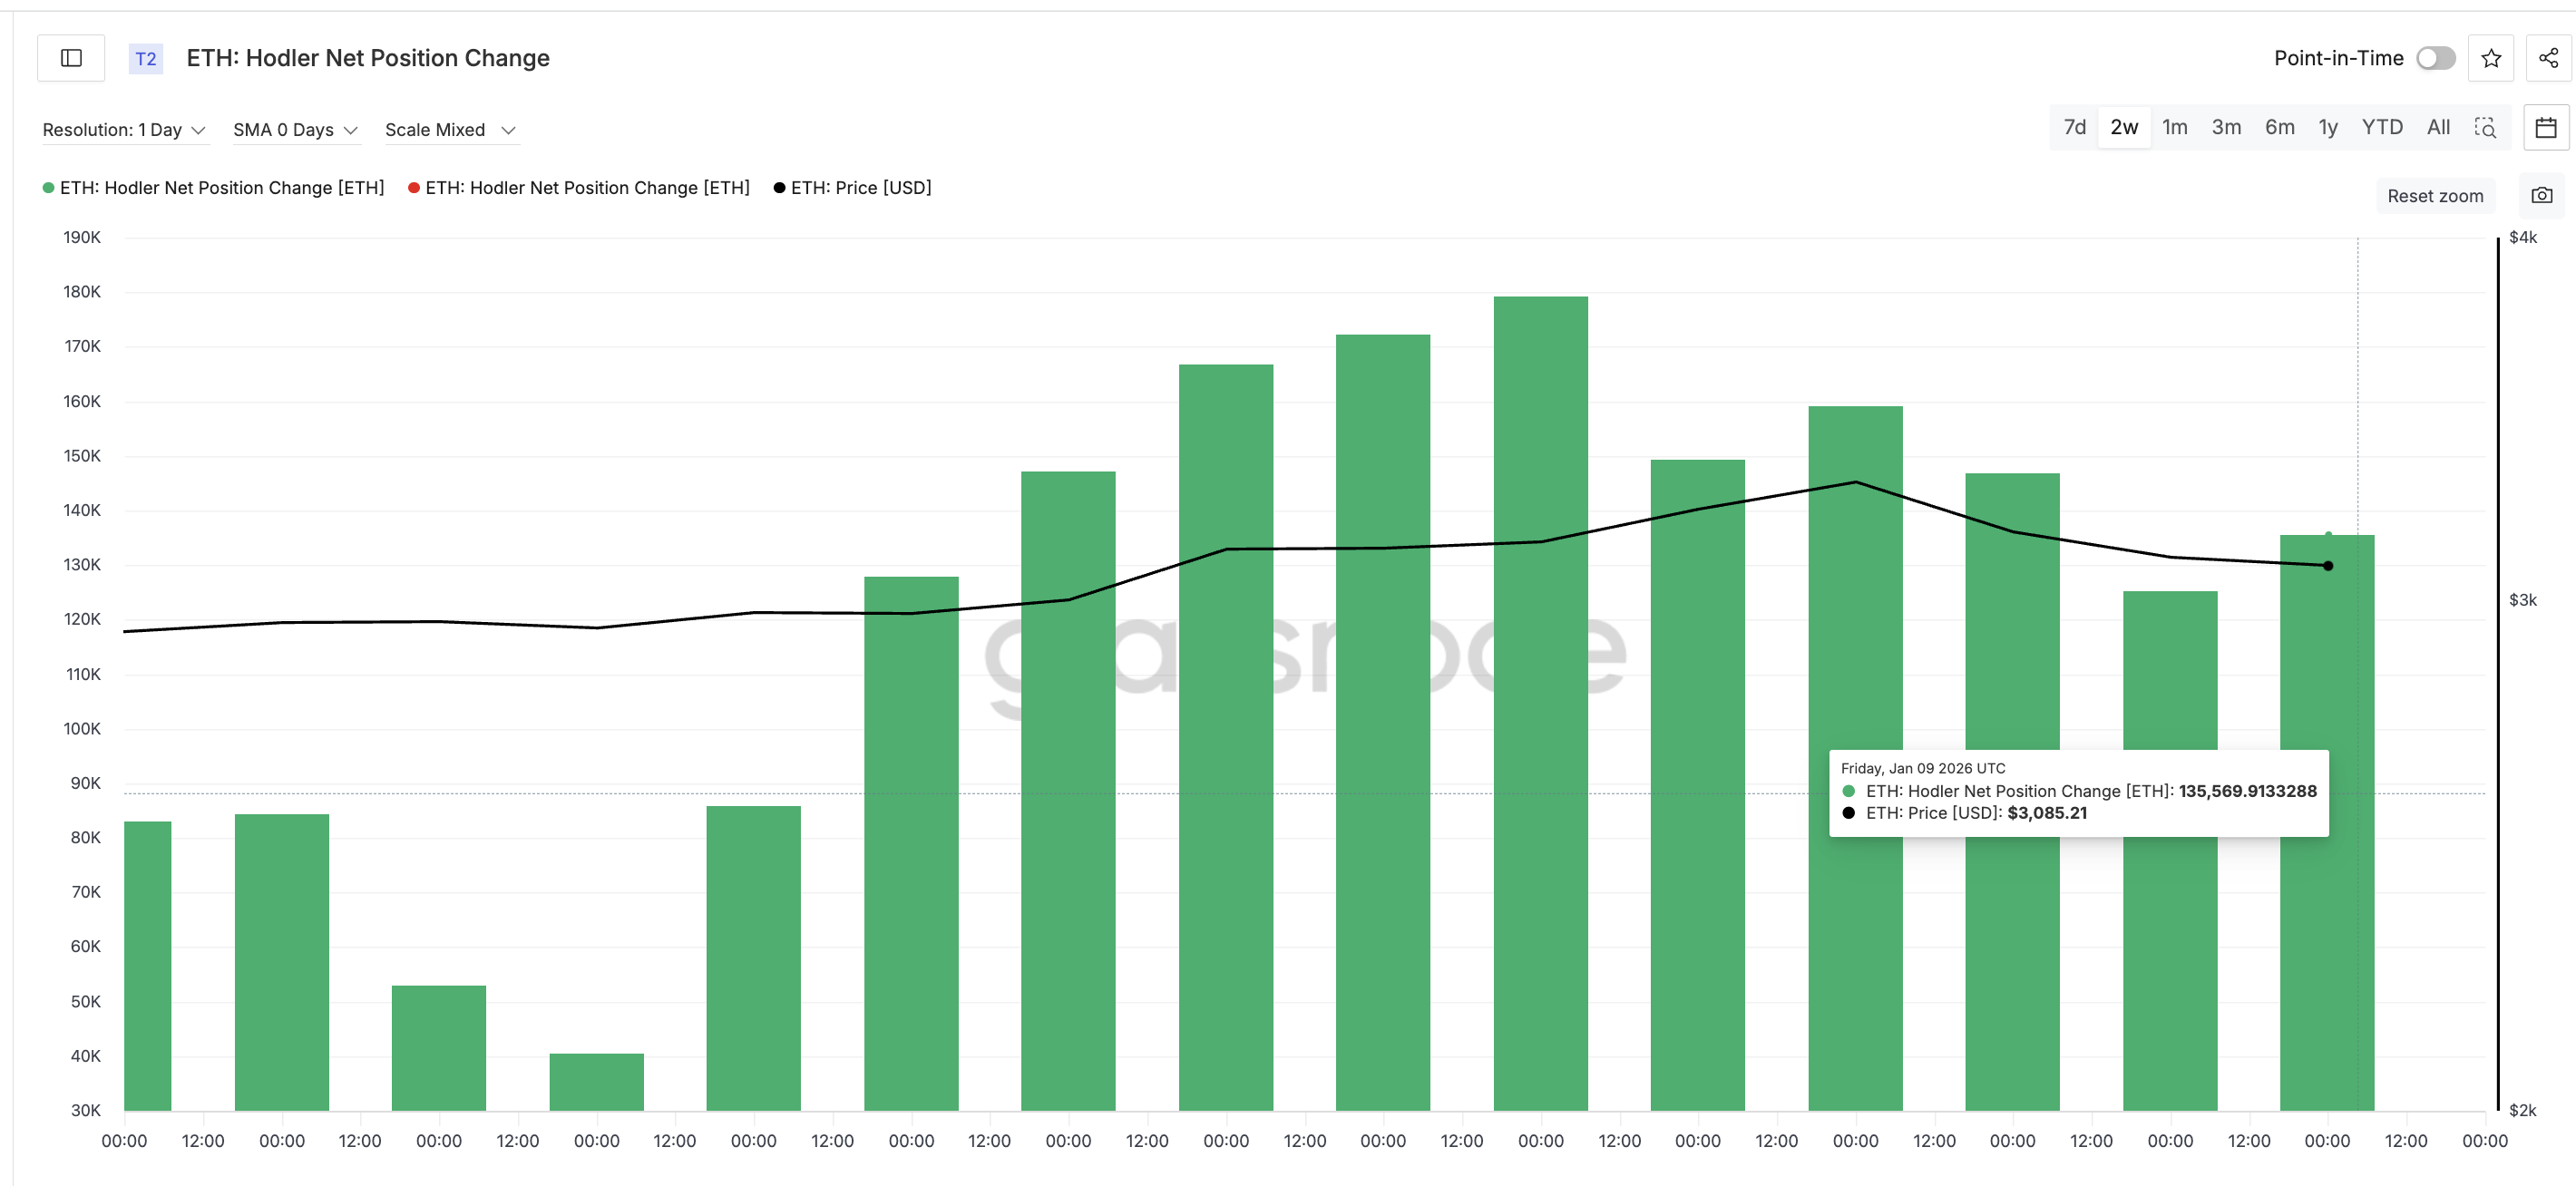
Long-term support is also weakening. The Hodler Net Position Change indicator tracks whether long-term holders are adding or reducing exposure. Although this indicator remains positive, buying pressure has clearly slowed down. Net inflows decreased from approximately 179,000 ETH on January 4th to approximately 135,500 ETH by January 9th, and the accumulation capacity decreased by 24%.
Sponsored Sponsored
Simply put, long-term holders are still buying, but they are becoming less aggressive. This reduces downside protection.
As spot support fades, attention turns to derivatives, where positioning often determines short-term direction.
Ethereum price level tightens, derivatives skew increases rebound risk
Derivatives data shows large imbalances.
In the major perpetual markets, cumulative short liquidation exposure is nearly $3.38 billion and long exposure is nearly $1.57 billion. This means short positioning outperforms longs by about 115%. Percentage-wise, the market is heavily tilted towards expecting prices to fall.
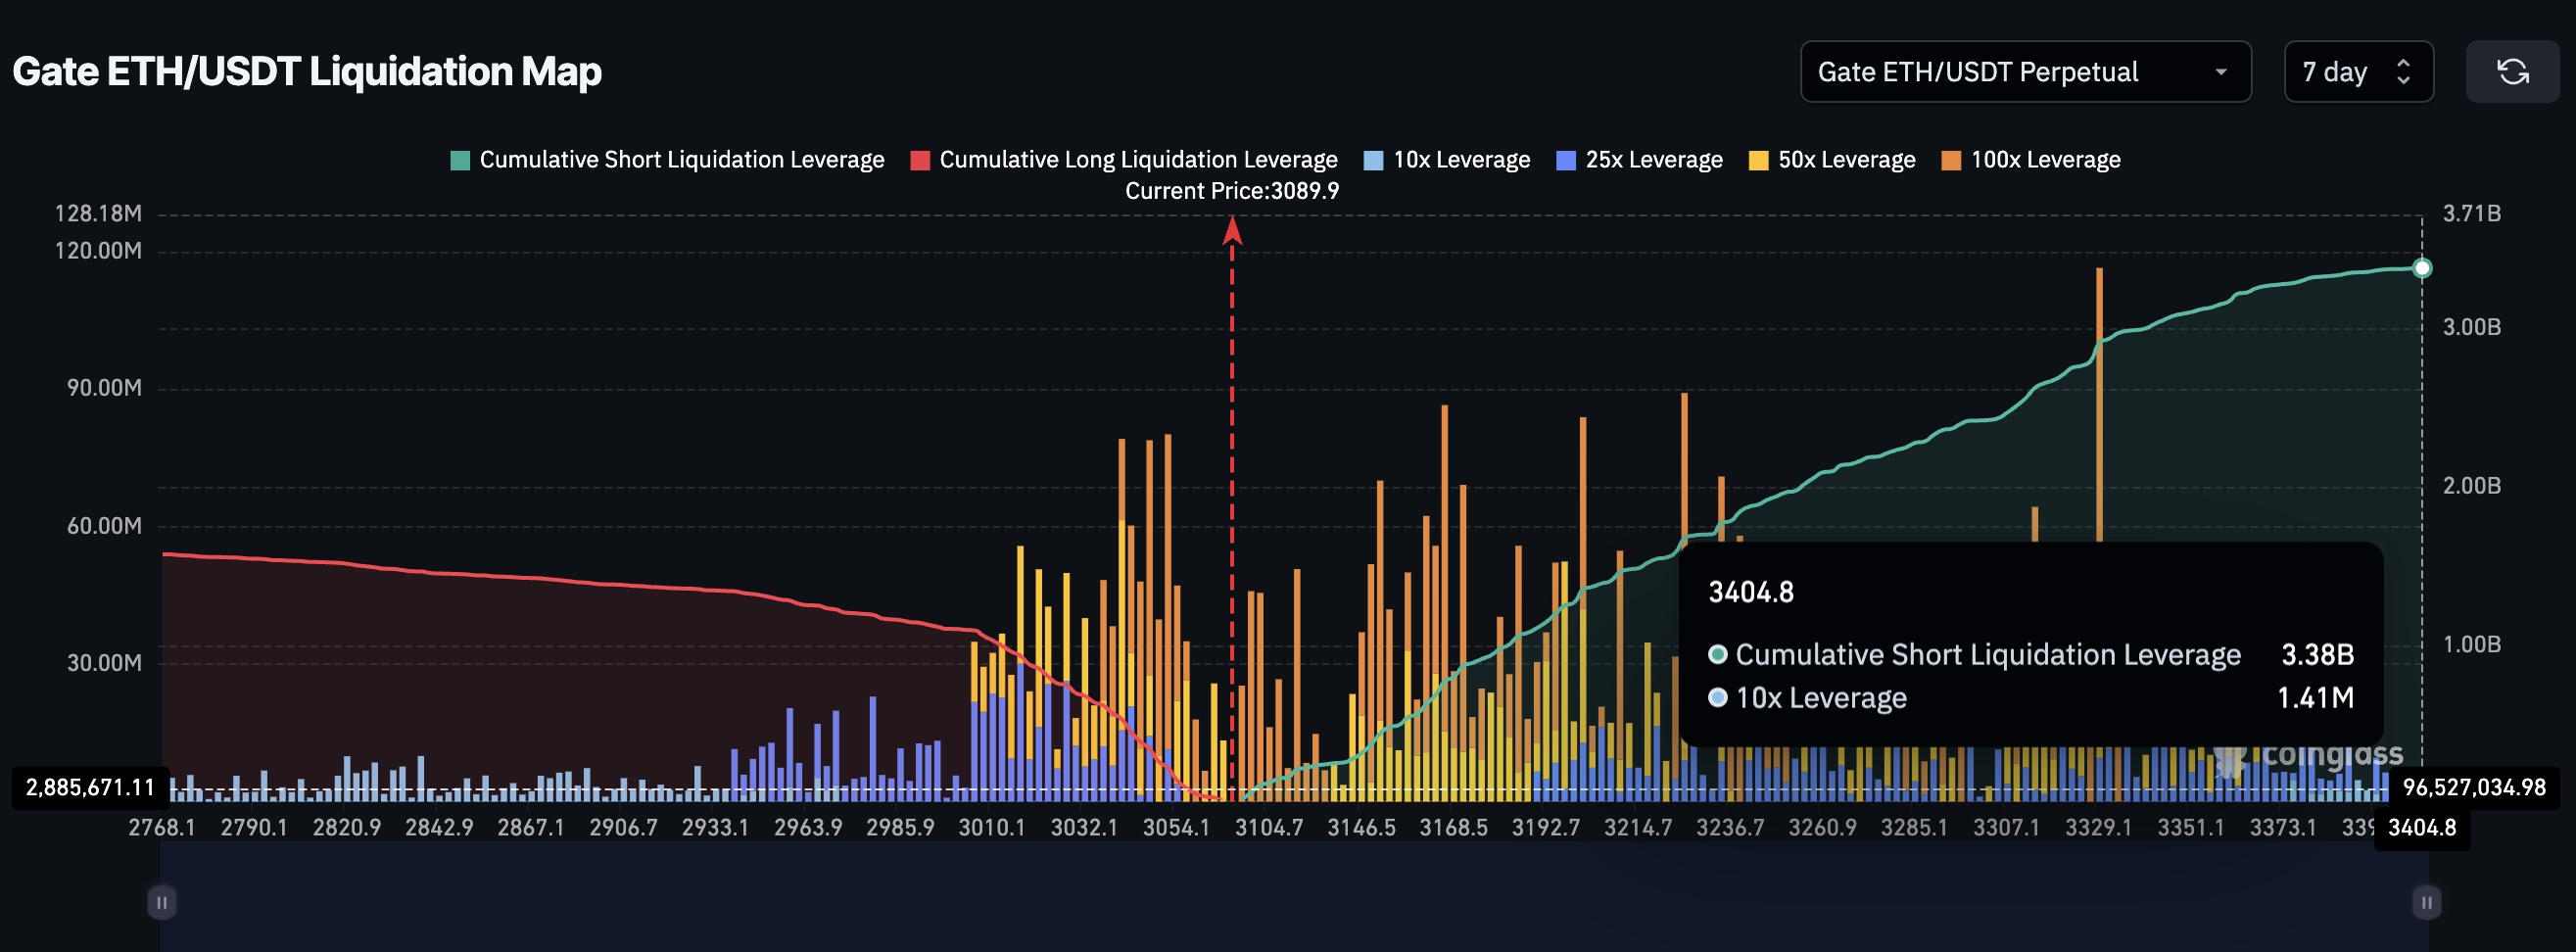
This is important because if the price starts to rise, crowded shorts can fuel an upward move. Forced short covering automatically creates buying pressure through a “short squeeze” phenomenon.
Sponsored Sponsored
That risk is concentrated around key levels. Ethereum is currently trading around $3,080. The first support level to look at is $3,050, which is one of the most important levels in the near term and is supported by multiple touchpoints.
This is followed by $2,890. A close of the day below $2,809 would confirm the bearish pattern with an expected 9% decline and complete the neckline break.
On the upside, $3,300 is the first level to weaken the bearish structure. When the daily close price rises above that zone, the right shoulder begins to become invalid. Further movement towards $3,440 will likely cancel the pattern completely and liquidate all 7-day short positions, consistent with a 12% pullback scenario.
Currently, Ethereum is caught between waning spot support and increasingly crowded short trades.
Ethereum’s price hasn’t collapsed yet, but it’s not safe either. Selling pressure has arrived and long-term buying has slowed by nearly a quarter, but short-term holders remain active. At the same time, derivative positioning leaves the door open to sharp countermeasures.
The next decisive move will come from the price itself. Whether Ethereum falls 9% or rises 12% will depend on who loses confidence first.