

Hedera’s native token, HBAR, fell approximately 4.5% in the 24 hours following the launch of Canary Capital’s Spot HBAR ETF on October 28th. HBAR’s price decline appeared to be a typical sell news reaction with traders taking profits after last week’s 18% rally.
Still, the broader impact of ETFs may only be delayed. Although short-term traders exited early, technical and on-chain data indicate that the decline in HBAR prices could lay the foundations for further gains. The ETF buzz may prove to be a late bloomer, with the biggest impact likely to be felt after short-term profit-taking has faded.
sponsored
Head and shoulder breakouts continue despite cooling momentum
On October 26th, HBAR confirmed an inverted head-and-shoulders breakout, a pattern that often signals the beginning of a new uptrend. From the close of the breakout candle, HBAR rose exactly to the expected target value around $0.219 before falling back.
That retracing does not invalidate your setup. This formation is valid as long as HBAR is above the right shoulder threshold of $0.161.
Want more token insights like this? Sign up for Editor Harsh Notariya’s Daily Crypto Newsletter here.
Chaikin Money Flow (CMF) supports this structure. This indicator measures the inflow and outflow of large investors. Prices adjusted above zero, indicating that large buyers took advantage of the drop in prices to step in and add new support to the base.
The only concern is that CMF hit a slightly lower low, meaning inflows are steady but slowing. So, while HBAR price growth still looks healthy, a short-term pullback is likely as new entrants absorb selling pressure.
sponsored
This new pullback-driven participation triggered after the ETF buzz could prove essential to sustaining the next stage of the rally.
Liquidation map signals potential short squeeze
The derivatives market also reflects this short-term uncertainty regarding ETFs. Many traders seem to believe that the “ETF buzz” faded after the correction, leading to a massive buildup of short positions.
The liquidation map, which shows where leveraged traders may be forced to close their positions, highlights this imbalance. At Bybit, short positions outnumber long positions by more than 2 to 1, with short positions totaling approximately 20.49 million USDT compared to long positions of 9.68 million USDT.
sponsored
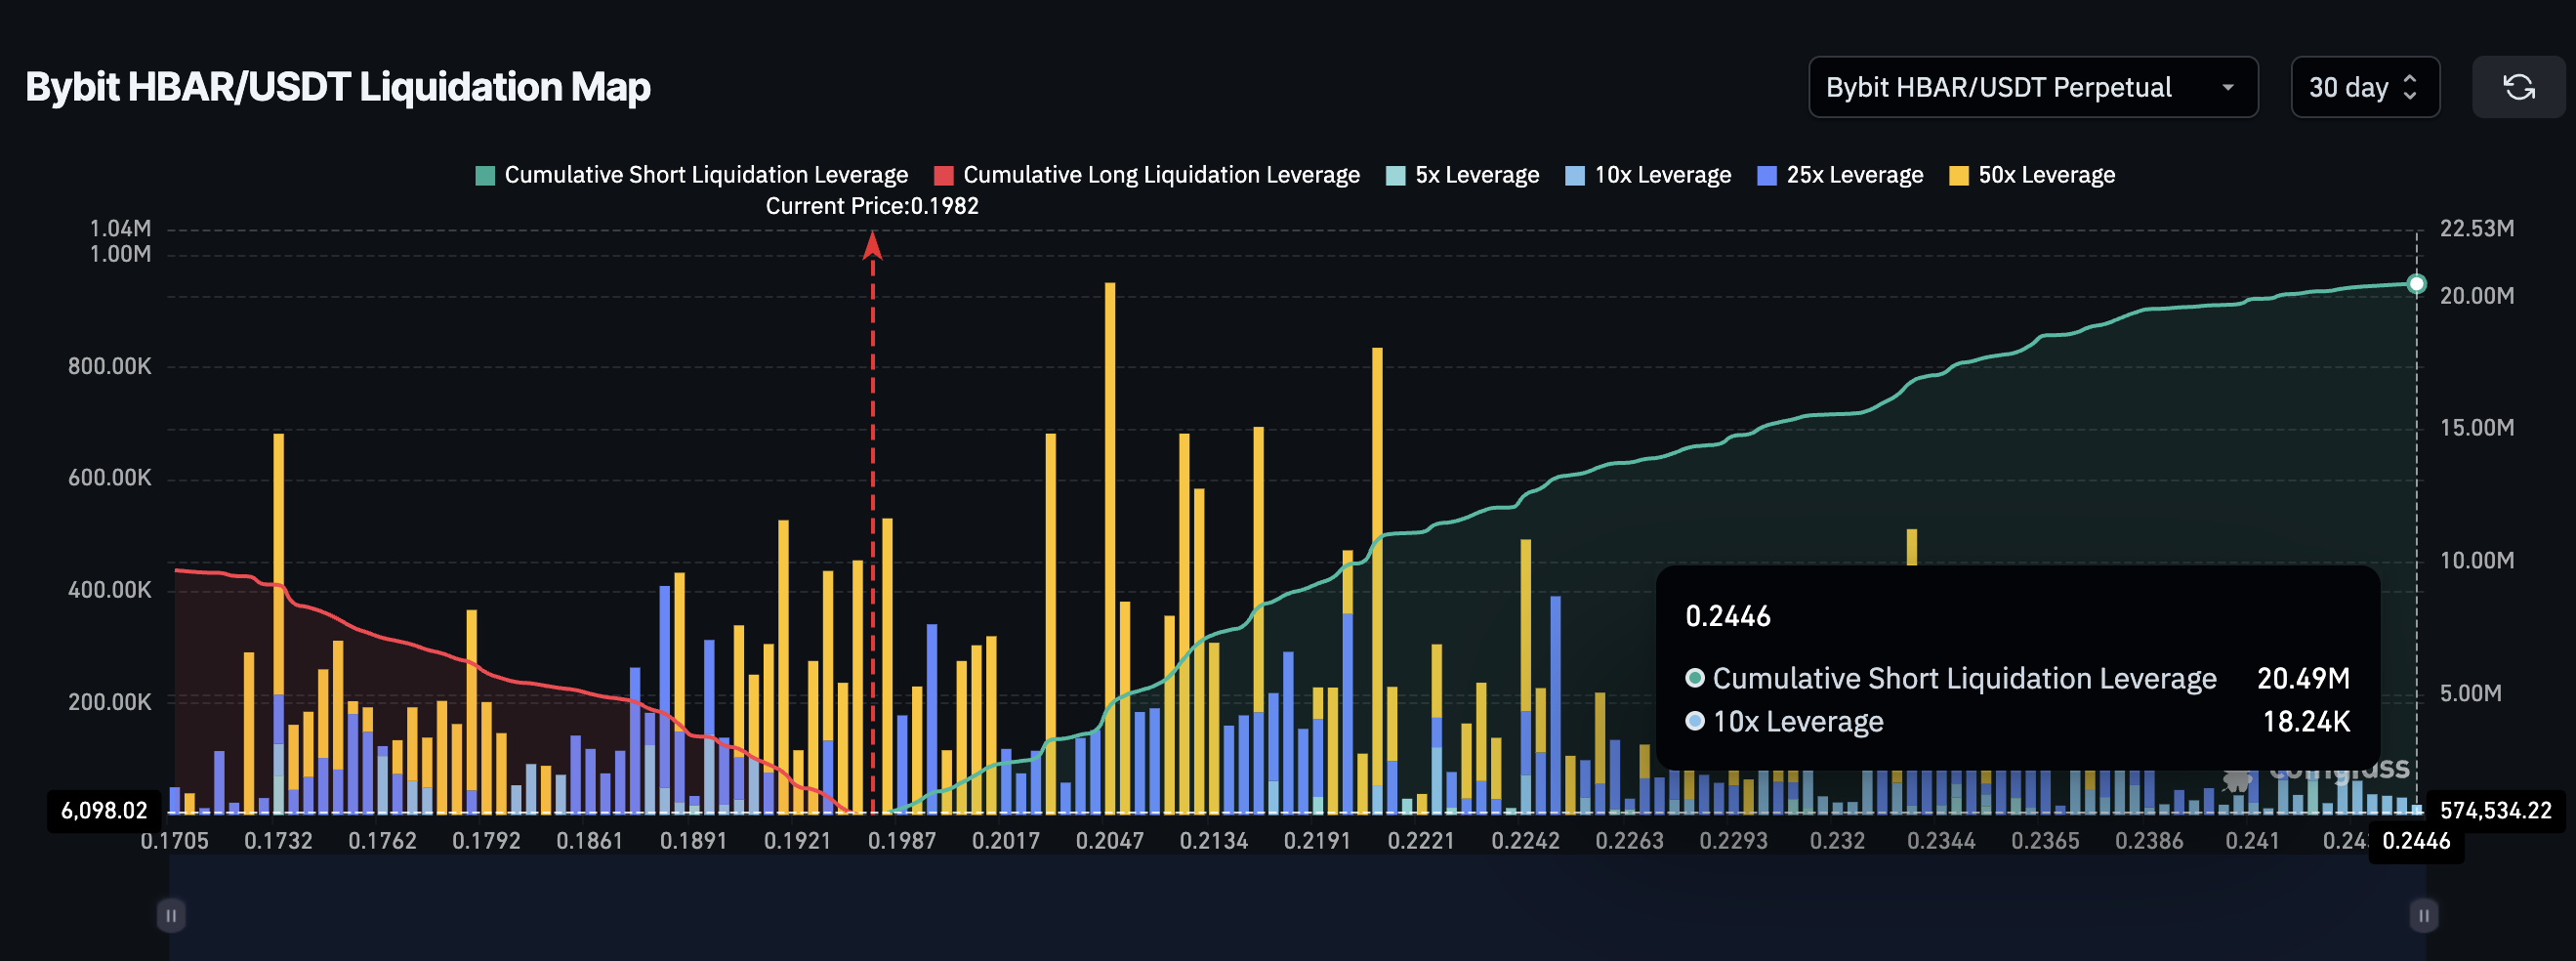
Shorts will start liquidating around $0.198. If HBAR rises above that mark, it could trigger an automatic wave of buybacks by short traders, or a short squeeze, causing the price to rise rapidly. According to the chart, most of the shorts will disappear once HBAR price breaks above the $0.219 mark.
This setup, when combined with new buying after the ETF decline, indicates that the post-ETF decline may be a setup step before the next leg of HBAR price increases.
Signs that HBAR price upward trend is gaining strength again
On the 4-hour chart, HBAR’s price structure remains strong. The token trades above the major Exponential Moving Average (EMA). These indicators smooth price data to show the overall direction of the trend. The 20EMA is approaching a crossover above the 200EMA and the 50EMA is approaching the 100EMA, both early indicators that momentum is returning.
sponsored
If this “golden” crossover occurs, HBAR prices will likely rise. Even the smallest surge will begin to eliminate the short, causing a squeeze setting. That can have a cascading positive impact on price movements.
Meanwhile, the Relative Strength Index (RSI), which measures buying and selling momentum, showed a hidden bullish divergence from October 27th to 28th. During this period, the price has made higher lows and the RSI has made lower lows, confirming that the underlying trend is still up.
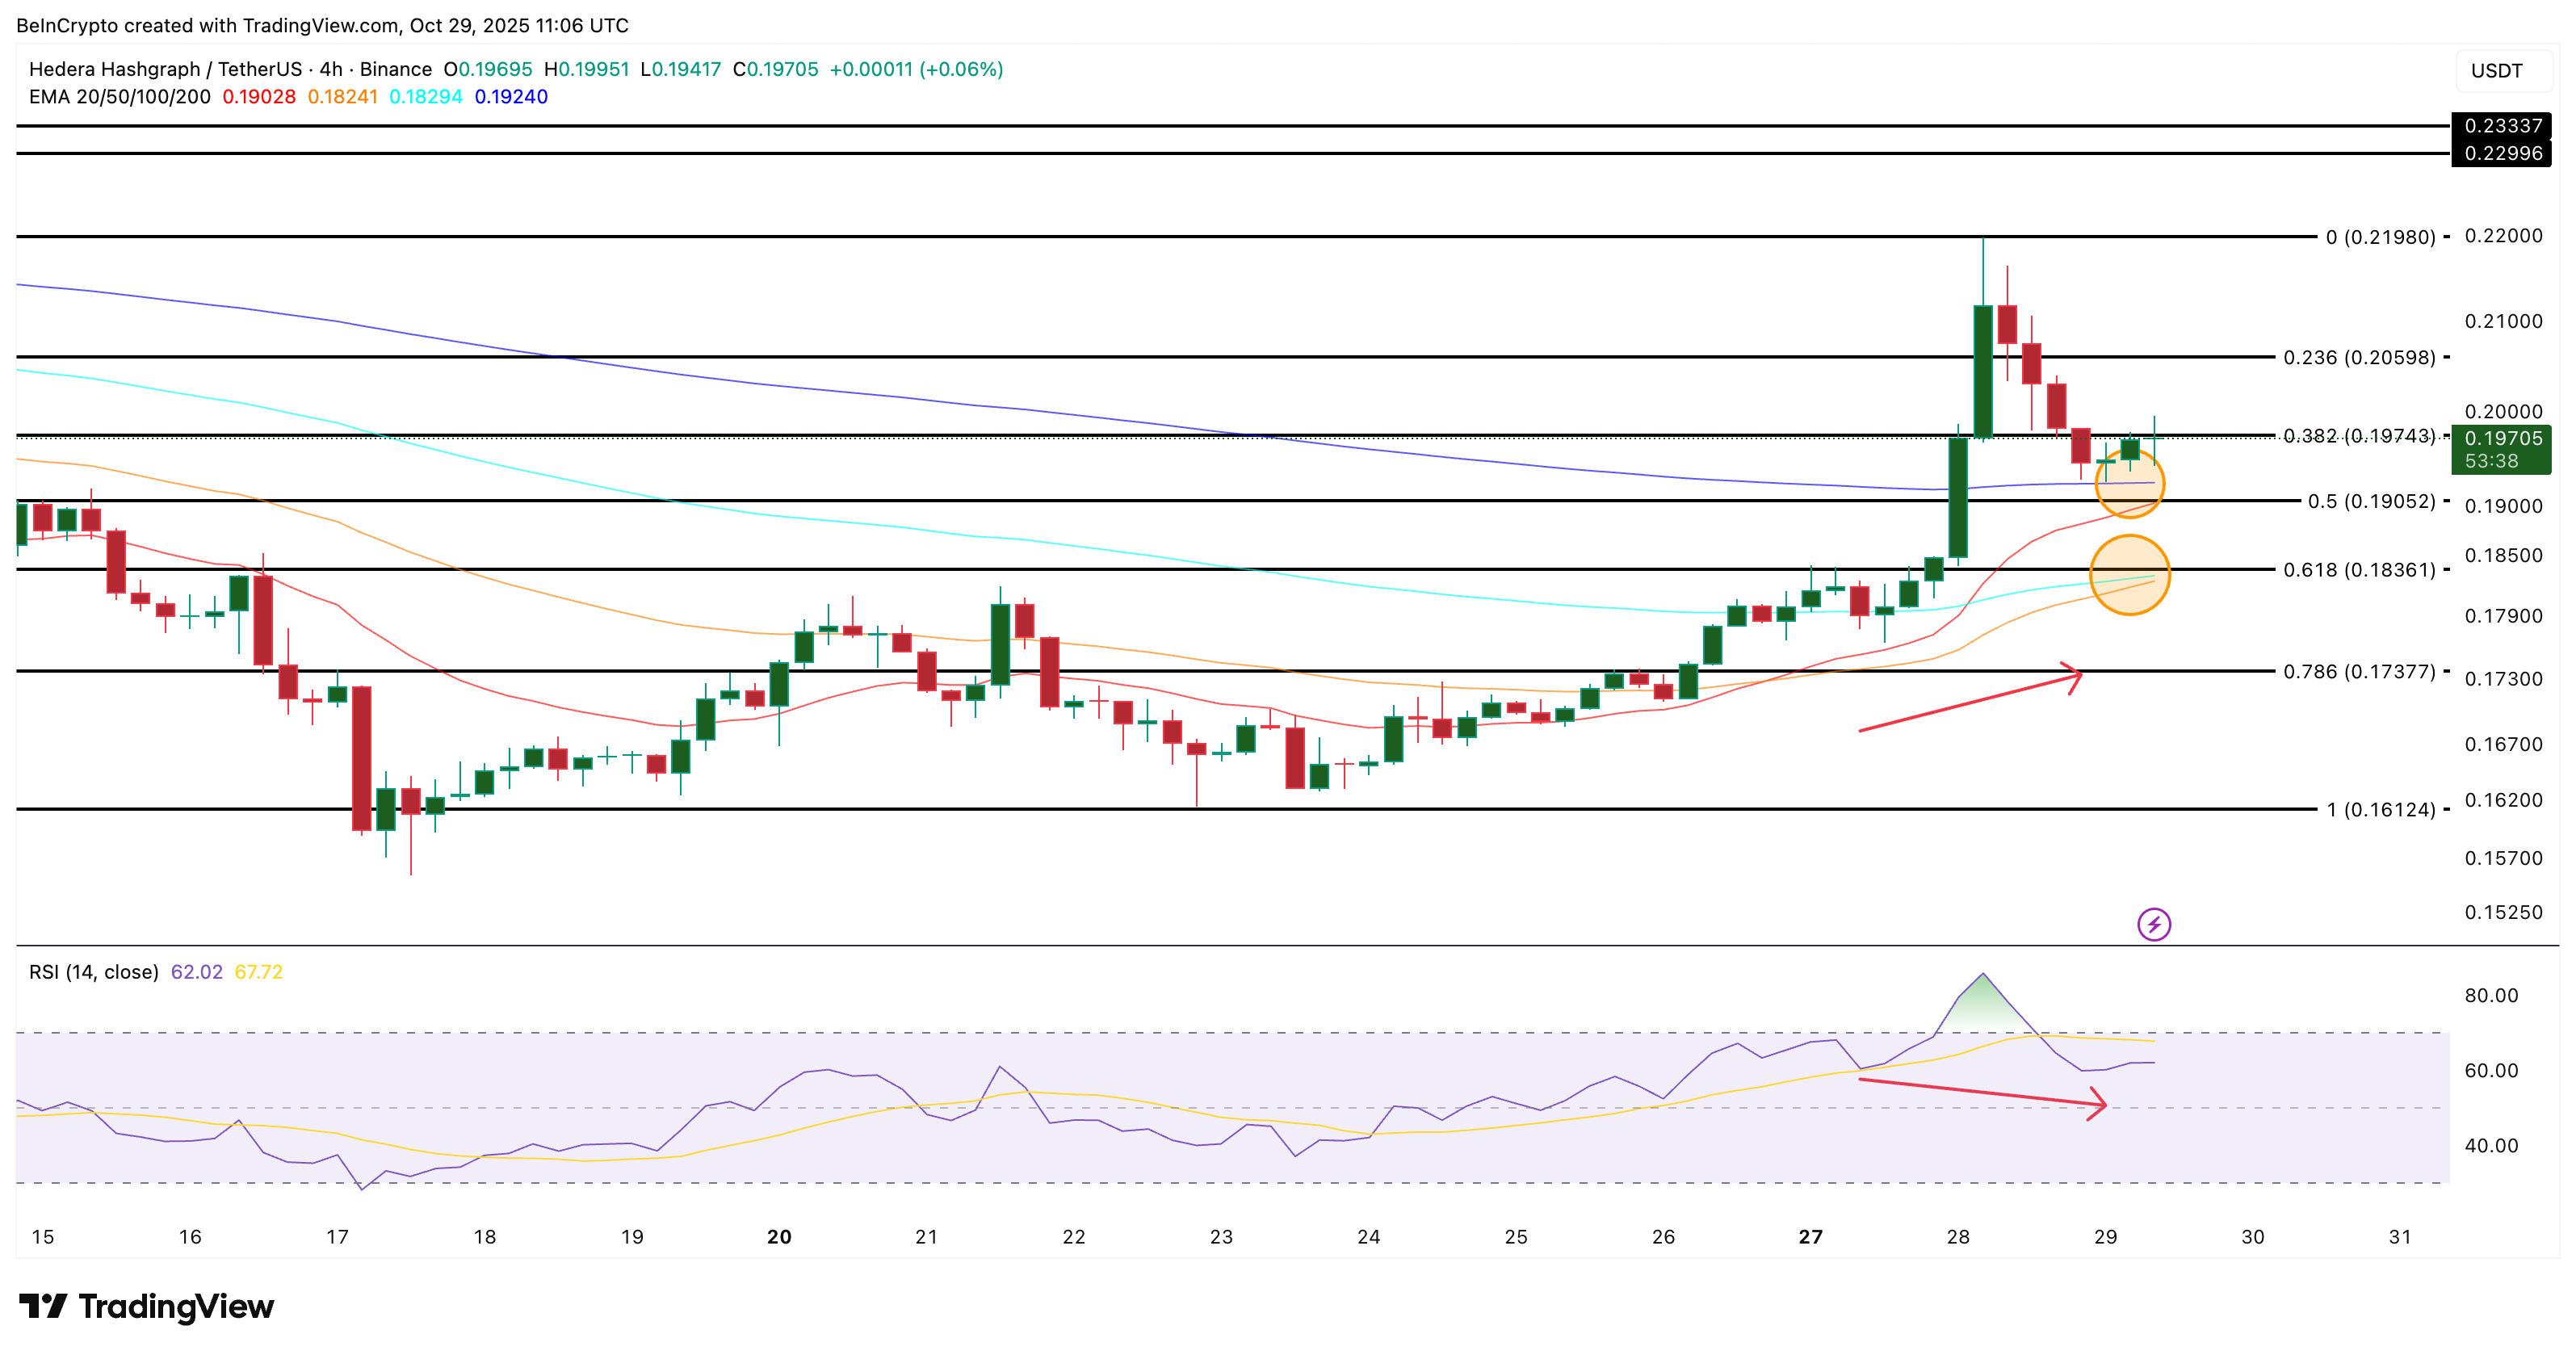
HBAR currently holds support near $0.197. If buyers defend it, the next upside targets are $0.205, $0.219 (last rejection level), and $0.233. However, a decline below $0.190 could weaken the structure and expose $0.173, invalidating the short-term view.
However, the inverted head-and-shoulders chart we shared earlier shows that a complete trend bust will only occur if the HBAR price falls below $0.161.