

XRP has risen nearly 6% over the past week, erasing some of last month’s weakness. Although still down in the three-month range, the token is up over 400% year-over-year, indicating that the larger upward trend remains unbroken.
Now, a small move of just 7% could unlock the next rally zone. The latest on-chain and chart signals suggest it could happen sooner than many expected.
sponsored
Whales and short-term charts suggest an uptrend is coming
Large-scale XRP holders are increasing again. Since yesterday, the stash of wallets with over 1 billion XRP has increased from 25.07 billion to 25.12 billion, with 50 million added.
In addition, approximately 70 million coins were added to wallets holding 10 million to 100 million XRP, bringing the total from 8.15 billion to 8.22 billion. In total, $314 million worth of tokens were added to these wallets.
This buildup often occurs when major companies expect near-term momentum to accelerate. The 4-hour chart supports this, showing an improvement in the short-term structure.
Want more token insights like this? Sign up for Editor Harsh Notariya’s Daily Crypto Newsletter here.
The 20-period exponential moving average (EMA) that tracks recent price momentum has already crossed above the 50-period EMA and is now approaching the 100-period EMA. It will form another golden crossover.
sponsored
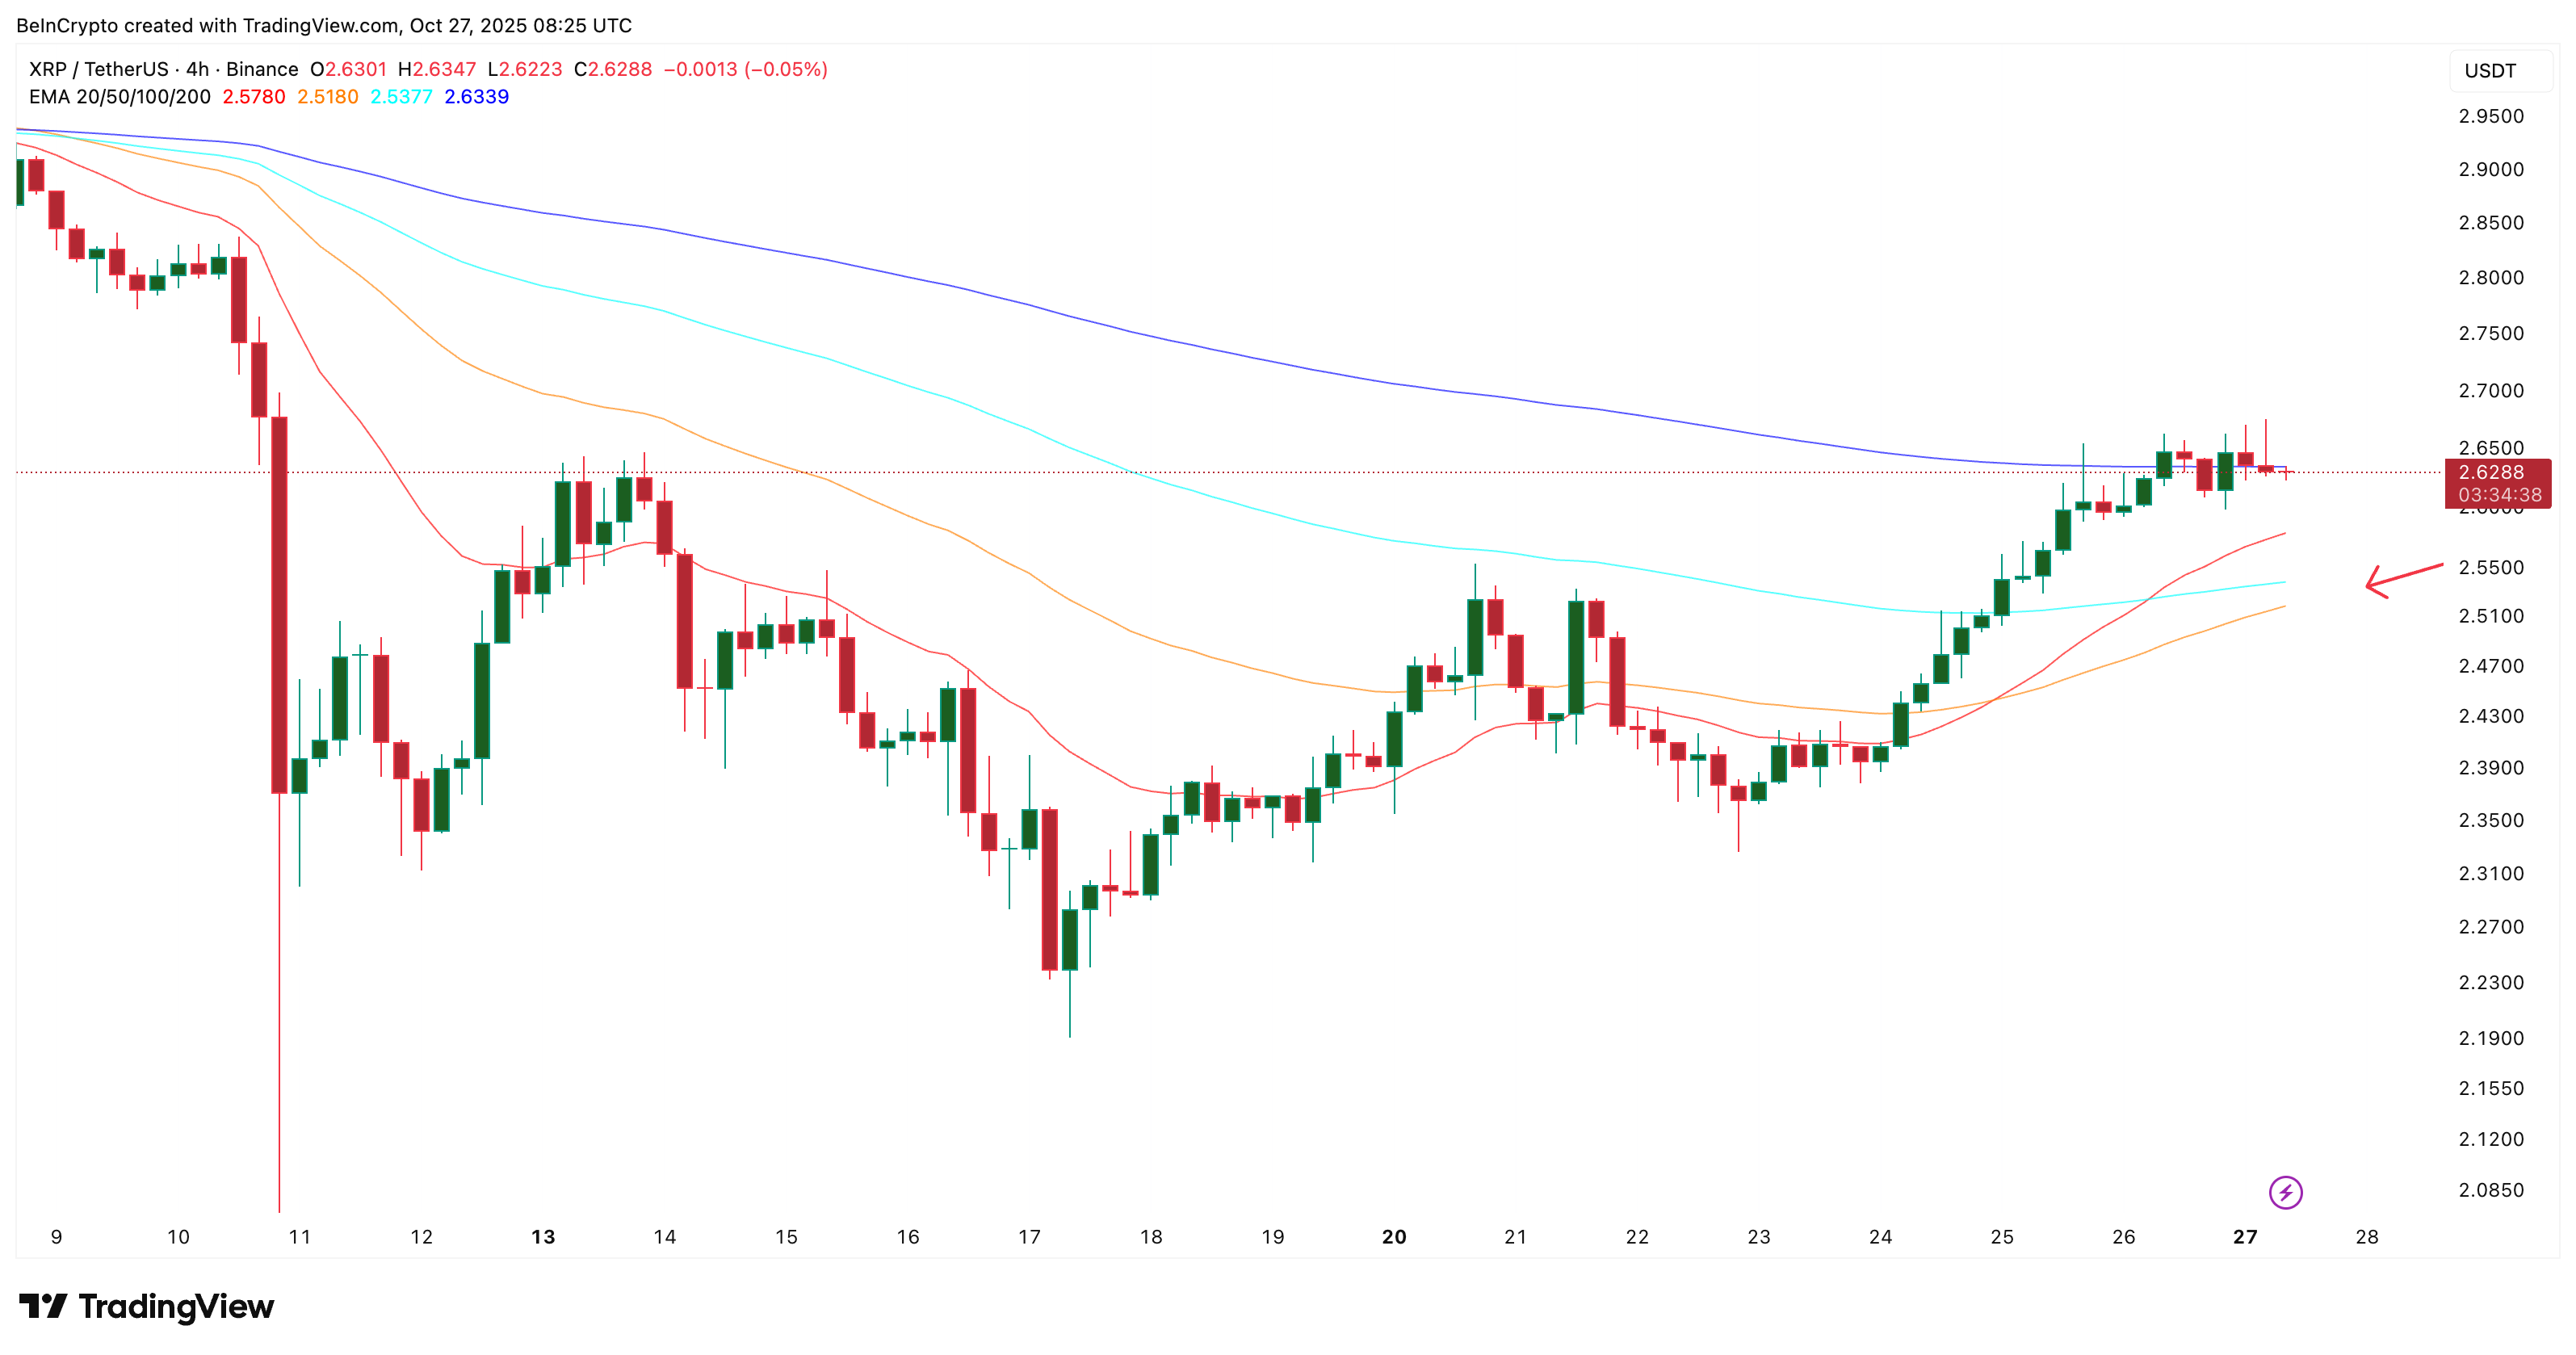
When a faster EMA crosses a longer EMA, it usually means buying power is increasing and traders are starting to position for a breakout.
A steady influx of whales combined with a strengthening short-term chart sets the stage to test the most important resistance in XRP price. We’ll find out more about that in the next section.
Cost-based heatmap shows where price competition is
Before looking at the price chart, a cost-based heatmap will help most holders understand where they sit in terms of potential profit or loss, and where they might be likely to sell.
sponsored
According to Glassnode data, the heaviest supply cluster is between $2.78 and $2.80. This zone is where approximately 135 million XRP was last acquired.
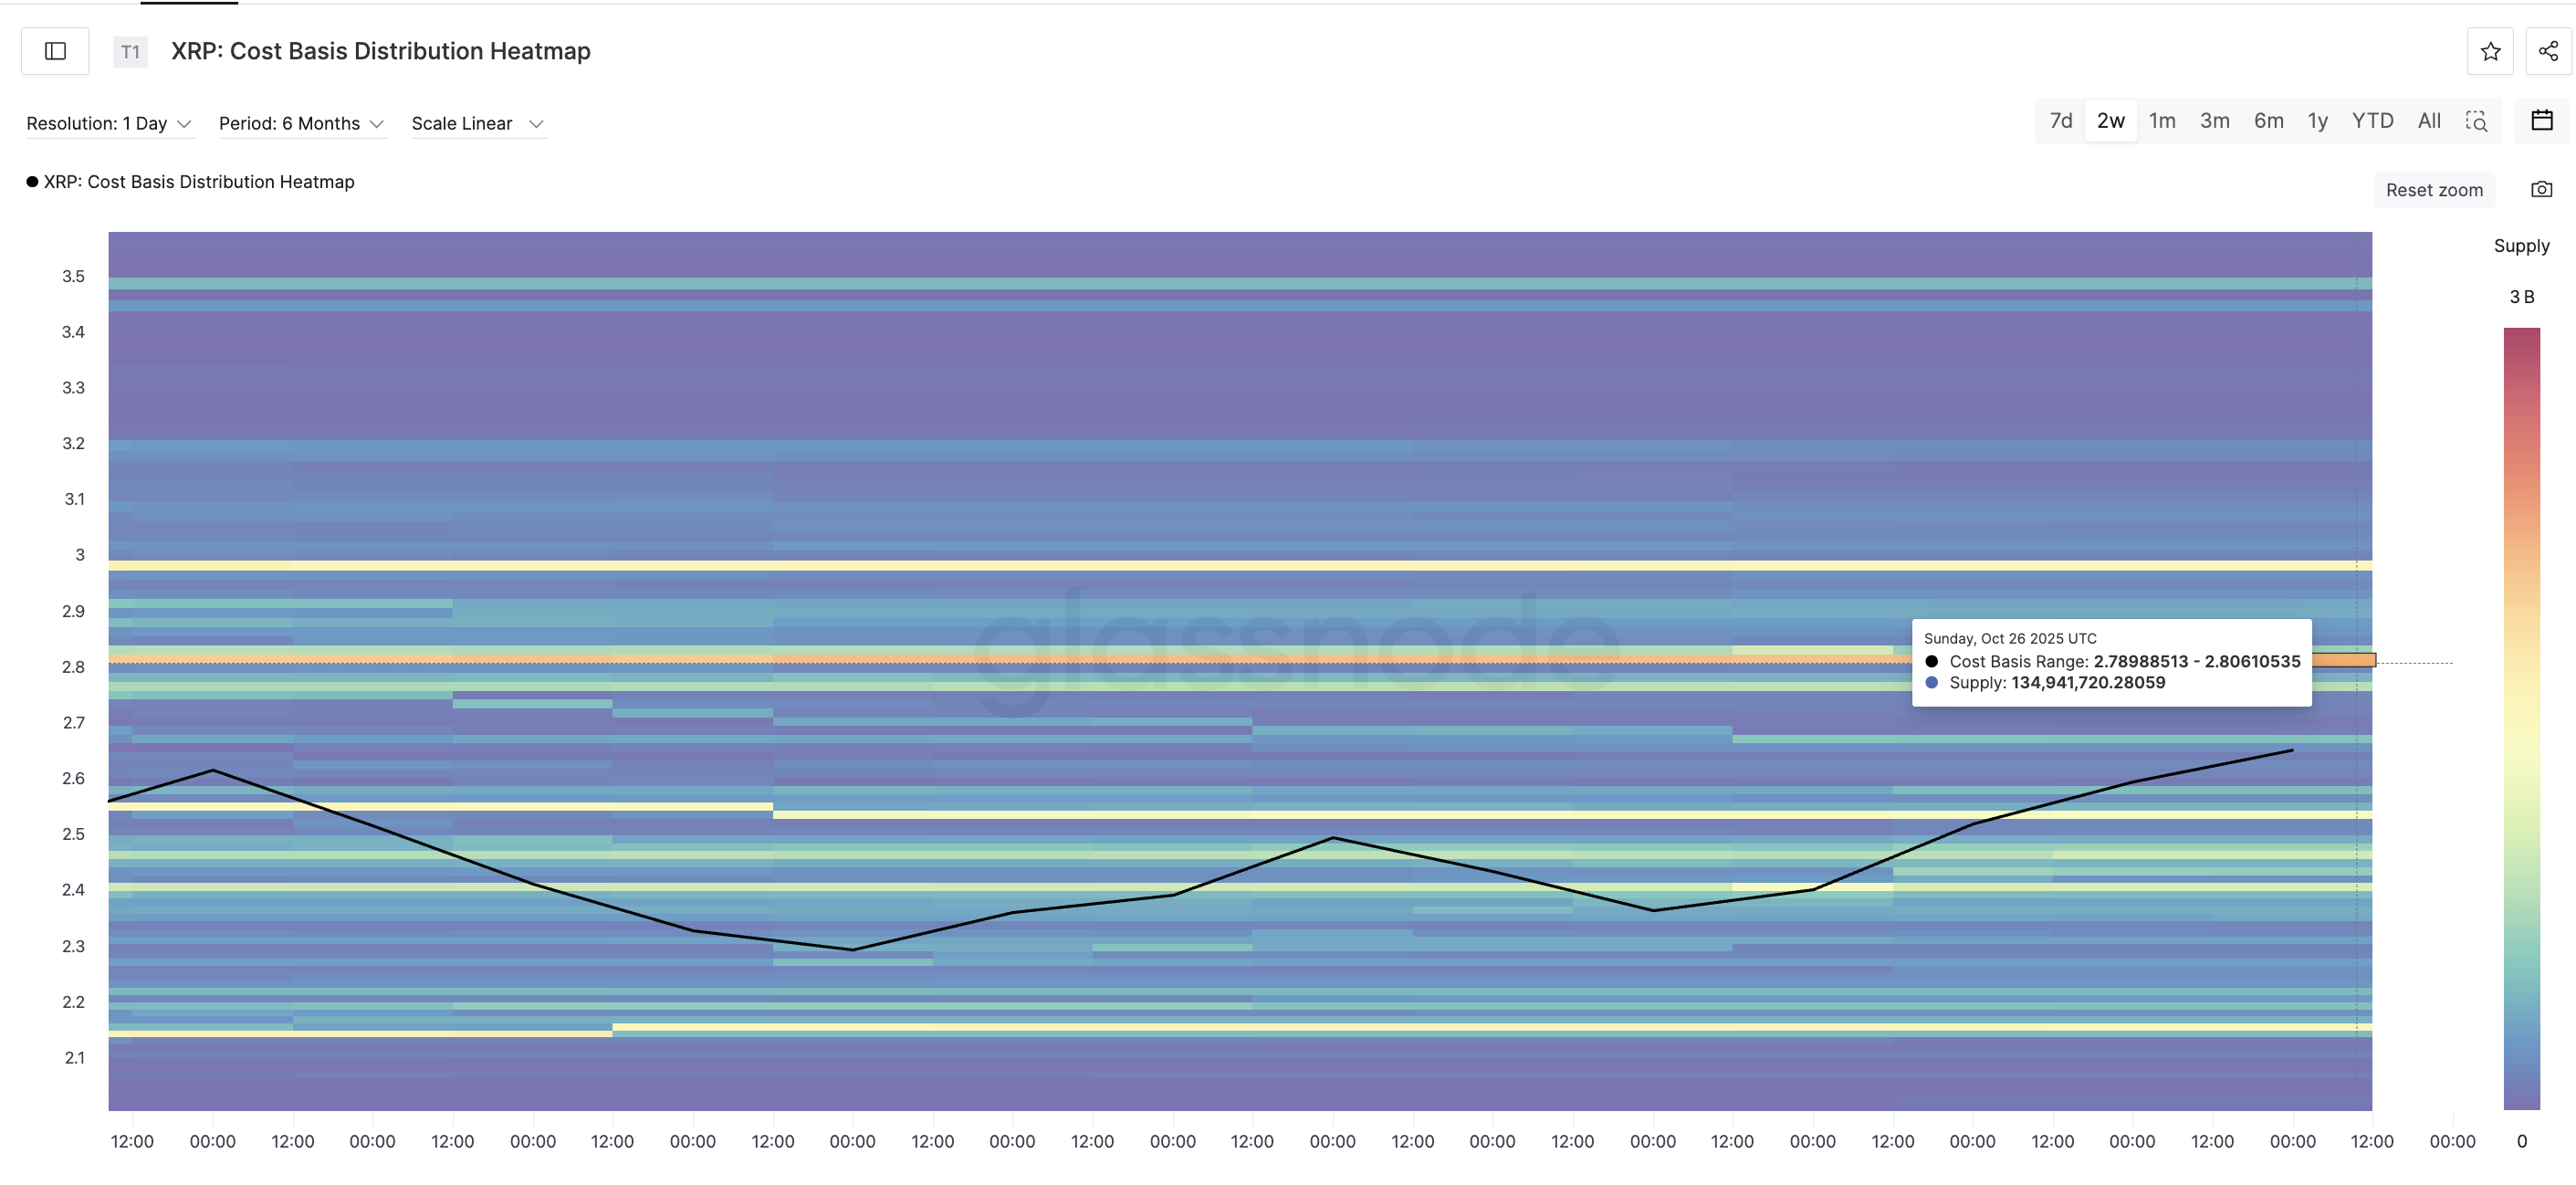
This is a zone where traders who previously bought may try to sell and lock in profits. Exceeding that means absorbing that supply, which often triggers follow-on buying.
That $2.78 to $2.80 zone is almost perfectly aligned with the next chart-based breakout level.
sponsored
What the XRP price chart shows
On the daily chart, XRP continues to trade within a falling wedge. This pattern usually signals a bullish reversal when the upper limit is broken. That border is around $2.81, the same level indicated by the dense supply band in the heatmap.
A close of the day above $2.81 would confirm the breakout and validate the technical and on-chain signals. Below that, price targets appear at $3.37 and $3.66.
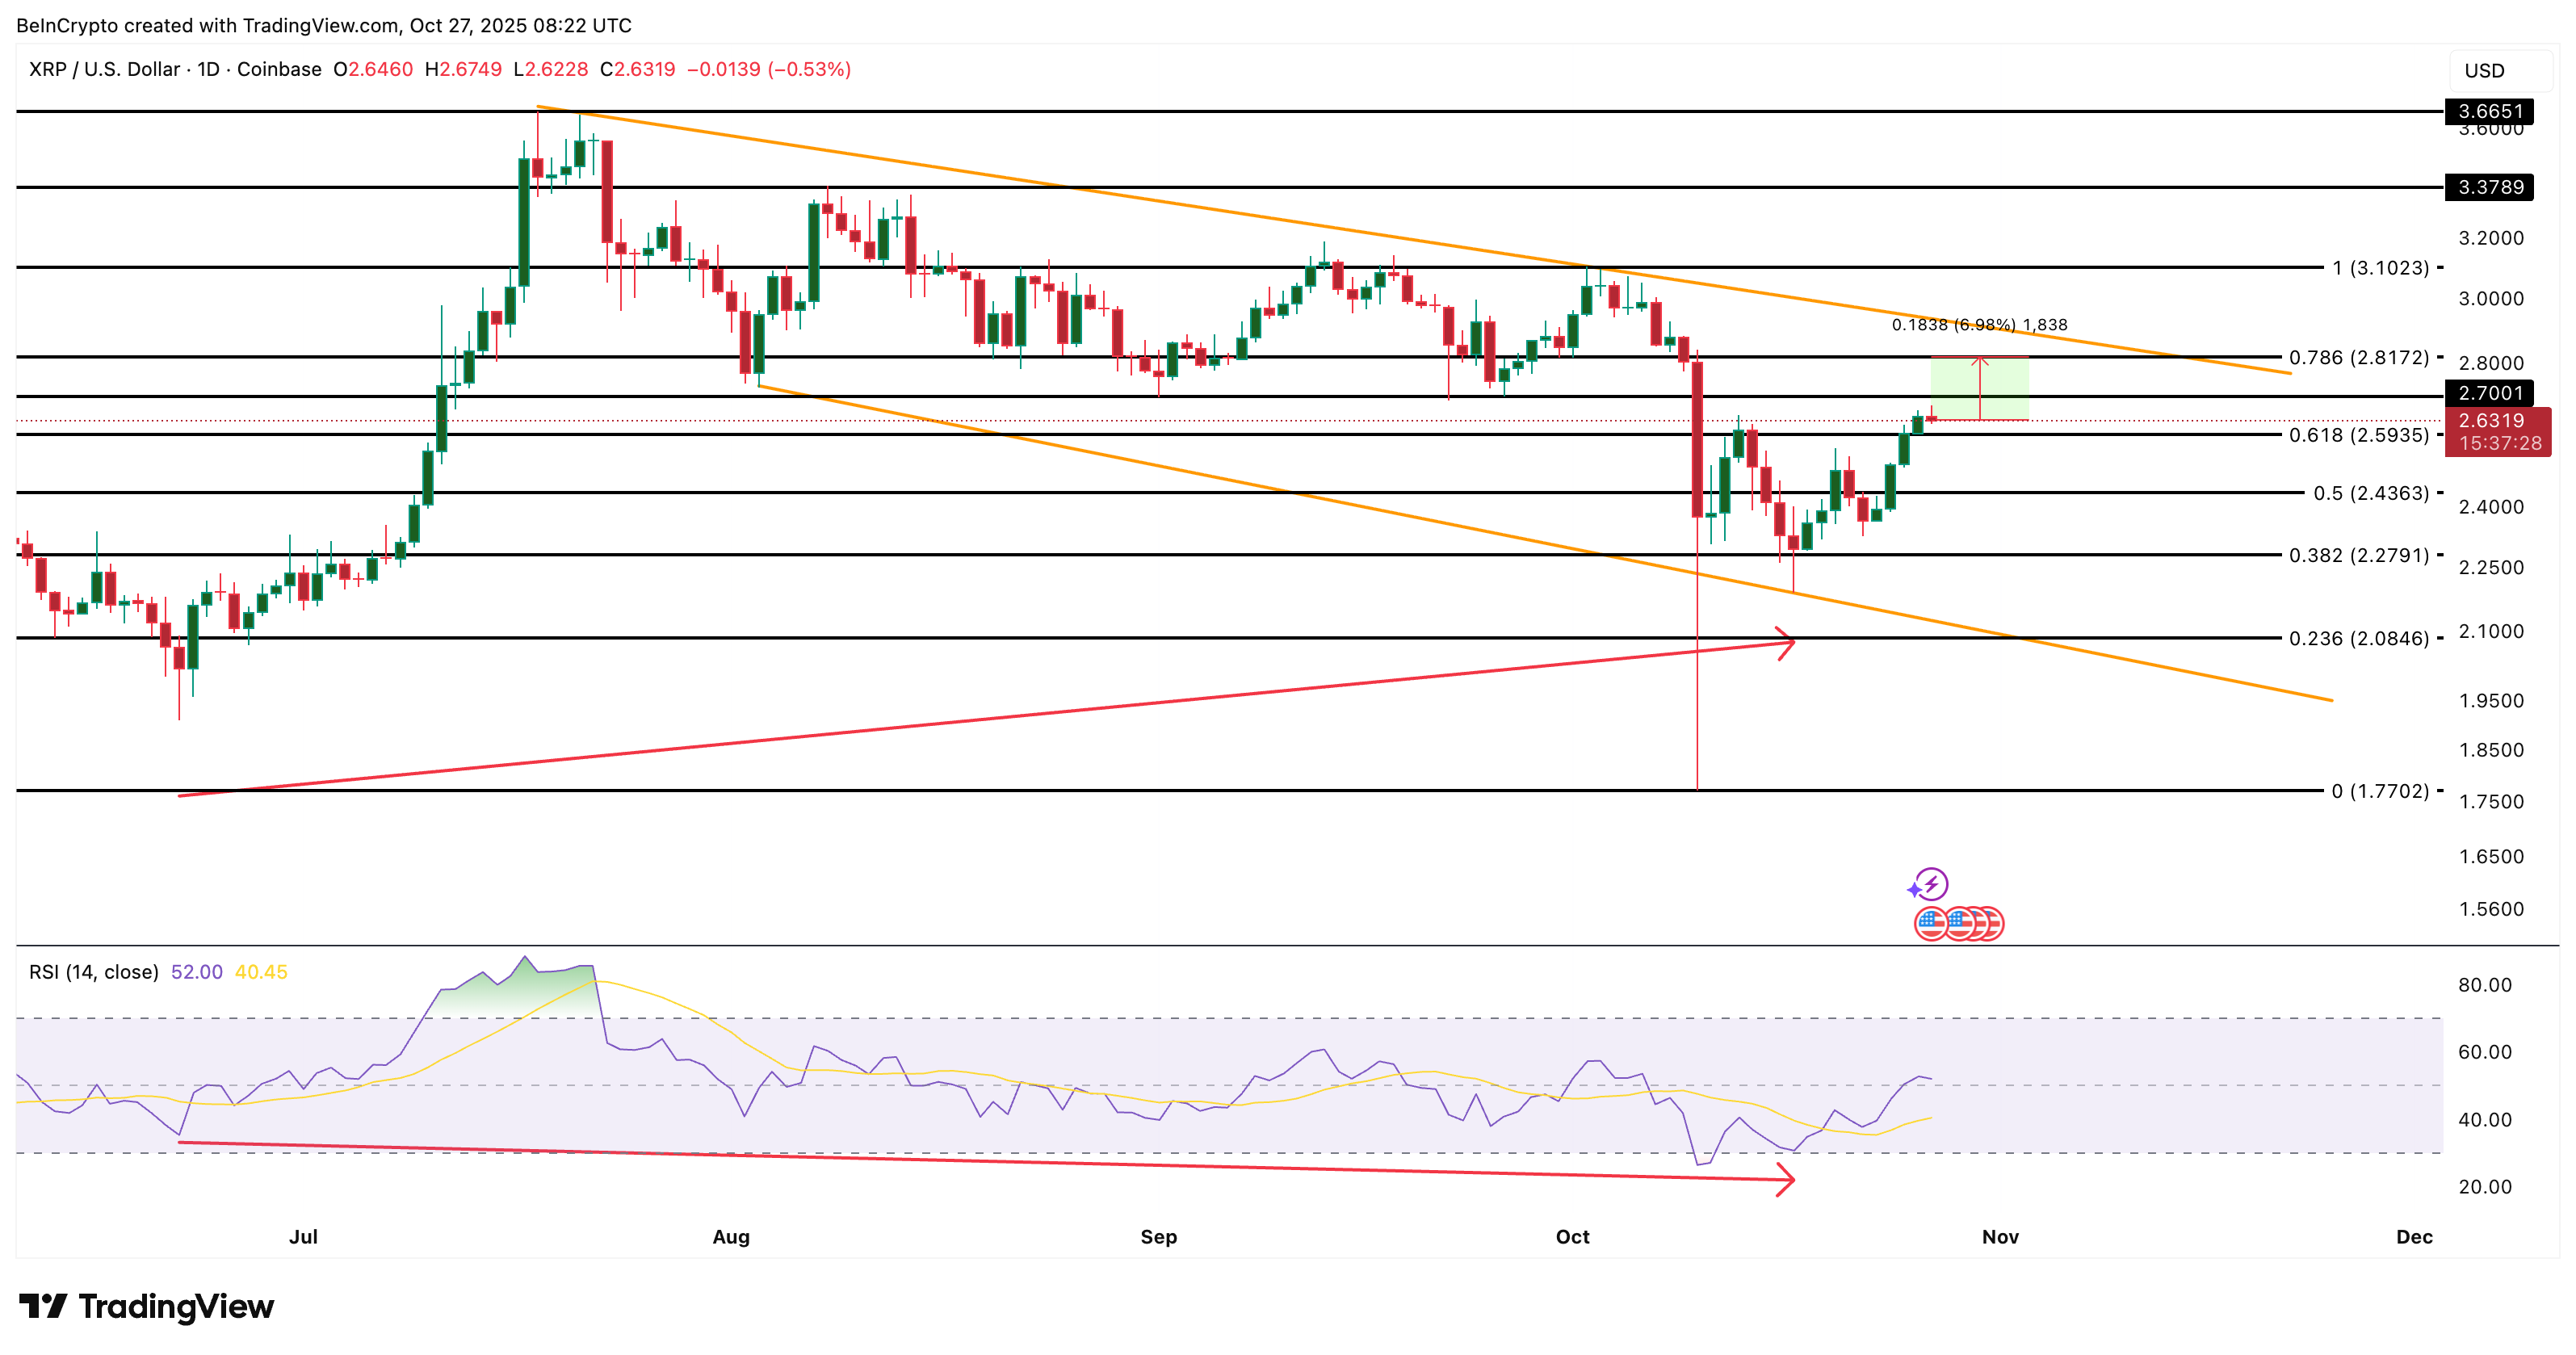
If XRP fails to rise above $2.81 and instead falls below $2.59, the next rally could be delayed. A loss of $2.43 could result in a return of $2.27, invalidating the short-term bullishness.
But for now, the combination of whale accumulation, a positive signal on the short-term EMA, and a zone of resistance centered just 7% (6.98% to be exact) away makes this setup difficult to ignore.