

XRP price has risen 5% in the past 24 hours and is trading around $2.46, extending the short-term recovery. However, the token remains down 18% over the past 30 days, indicating that a full recovery is still underway.
Recent on-chain trends suggest that one group is easing selling pressure while another major group is increasing their XRP exposure, a sign that confidence is returning. But everything still depends on one important XRP price level.
Sponsored Sponsored
Holders’ redemptions decline as short-term investors enter the market
Hodler Net Position Change, which measures the amount of XRP accumulated or sold by long-term holders, shows a notable improvement in investor behavior. From October 16th to 17th, long-term holders sold heavily and the indicator fell to -18.57 million XRP.
However, by October 19th, the net outflow had significantly decreased to -3.28 million XRP, and the selling pressure had decreased by over 82%. And XRP price has been rising a bit more aggressively since then.
Want more token insights like this? Sign up for Editor Harsh Notariya’s Daily Crypto Newsletter here.
This suggests that long-term investors are no longer aggressively offloading and may be bracing for a price recovery.
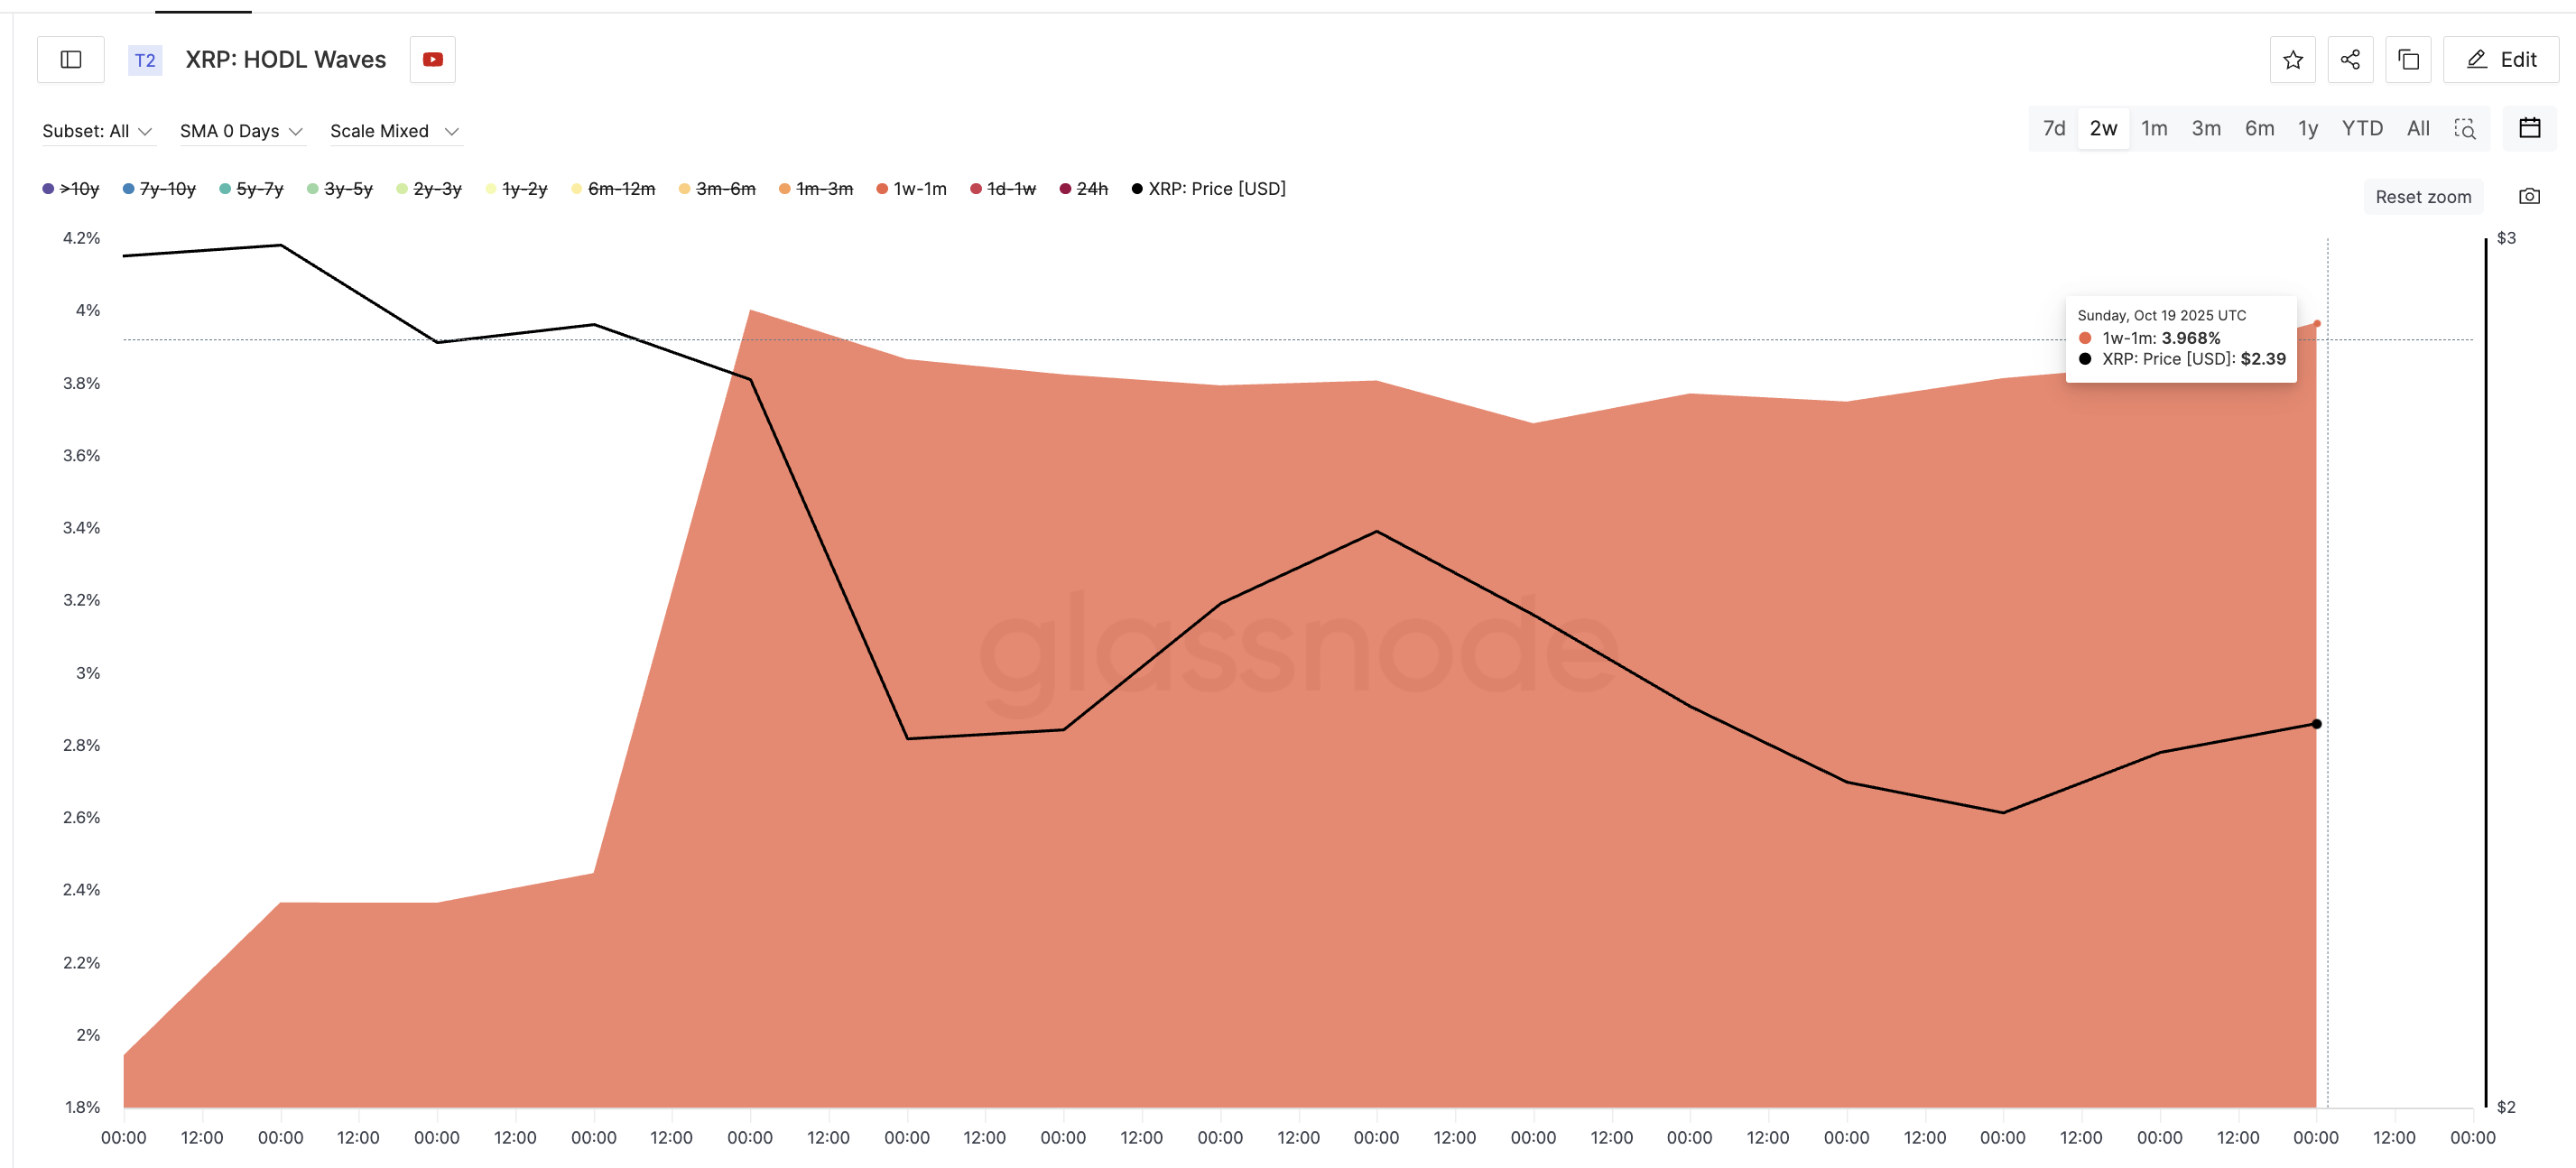
At the same time, the 1-week to 1-month group, typically short-term traders, increased their share of the total XRP supply from 1.94% on October 5th to 3.97% on October 19th. This HODL wave indicator shows that this short-term group is currently holding (and even accumulating) rather than exiting.
Sponsored Sponsored
HODL Waves shows how much of a coin’s supply investors hold over different time periods.
The combination of long-term sell-off easing and new short-term accumulation paints a positive outlook for XRP price.
XRP price rise requires 5.4% rally and retail support
On the technical side, XRP price has finally broken above the key resistance level at $2.43. This is the level that capped any recovery attempts earlier this month. The next hurdle is $2.59 (another important upper resistance level), which is about 5.4% above the current price.
If the daily candlestick closes above $2.59, it would indicate a possible breakout and pave the way for the key Fibonacci levels of $2.81 and $3.10.
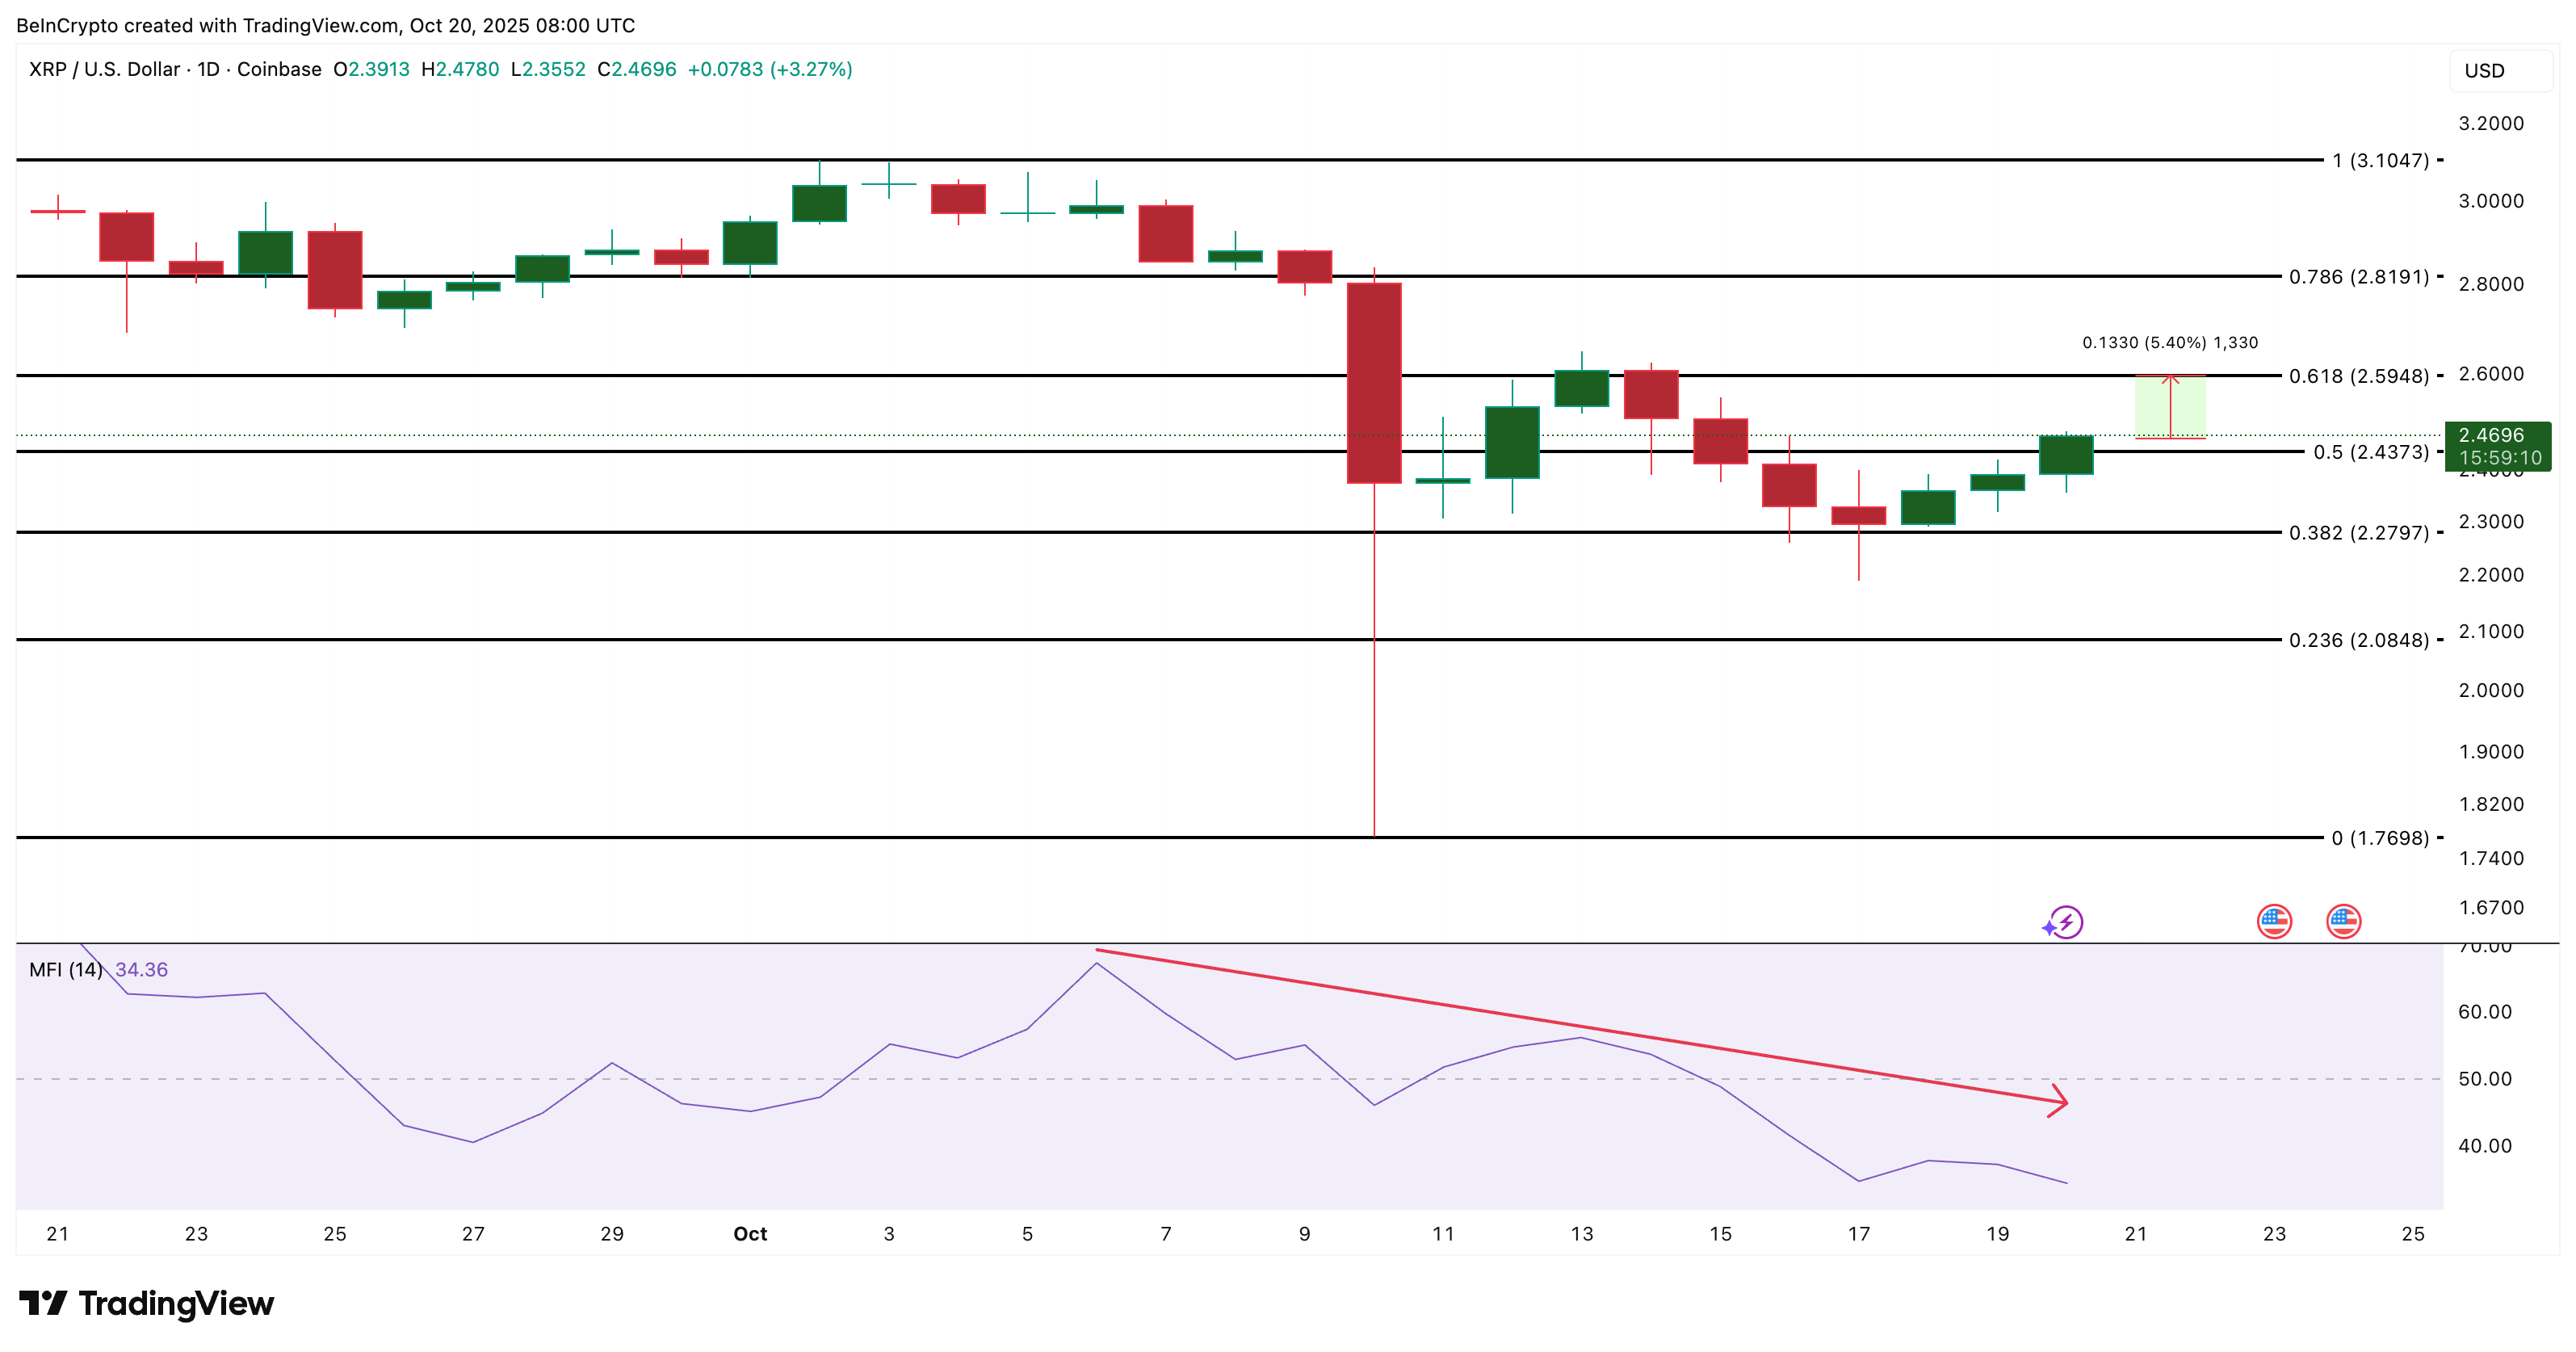
However, the Money Flow Index (MFI), which tracks purchasing pressure, has been trending downward since October 6. This indicates weak retail participation despite price increases. For a bullish setup to be fully operational, small trader buying activity must pick up.
If XRP price fails to sustain above $2.43, a fall below $2.27 could invalidate the bullish outlook. And that could cause the token to fall further towards $2.08 and $1.76.