

Oil prices soared this week, the biggest shock in months, as Middle East conflict sent Brent crude oil futures (ICEEUR:BRN1!) up to $82. Brent is a global oil benchmark that is widely used to set international crude oil prices and is the clearest measure of oil price response to geopolitical risks.
Breakouts are tracked on CFD (Contracts for Difference) charts and reflect the price structure, but not the actual position. However, futures data from ICE Futures Europe confirmed that real traders had entered the market, proving that the oil price hike was a geopolitical and positioning-driven move.
Soaring oil prices and strong dollar create initial stress at $82
Following the US and Israeli attacks on Iran, oil prices have soared from about $72 to $82. The retaliation has raised fears that supplies through the Strait of Hormuz, a key route that carries nearly a fifth of the world’s oil flows, could be disrupted. This sudden re-pricing added a war premium, meaning traders were pushing oil prices higher due to expected supply risks rather than immediate shortages.
This shock caused the gap in Brent crude to rise. Such moves often face initial stress, as markets tend to retest some of their gains before continuing higher.
This stress manifested itself around $82 as Brent crude corrected to $79.
The latest candlestick closed in the red with increased volume. Red volume indicates increased trading as oil prices corrected after gapping up, indicating active selling pressure.
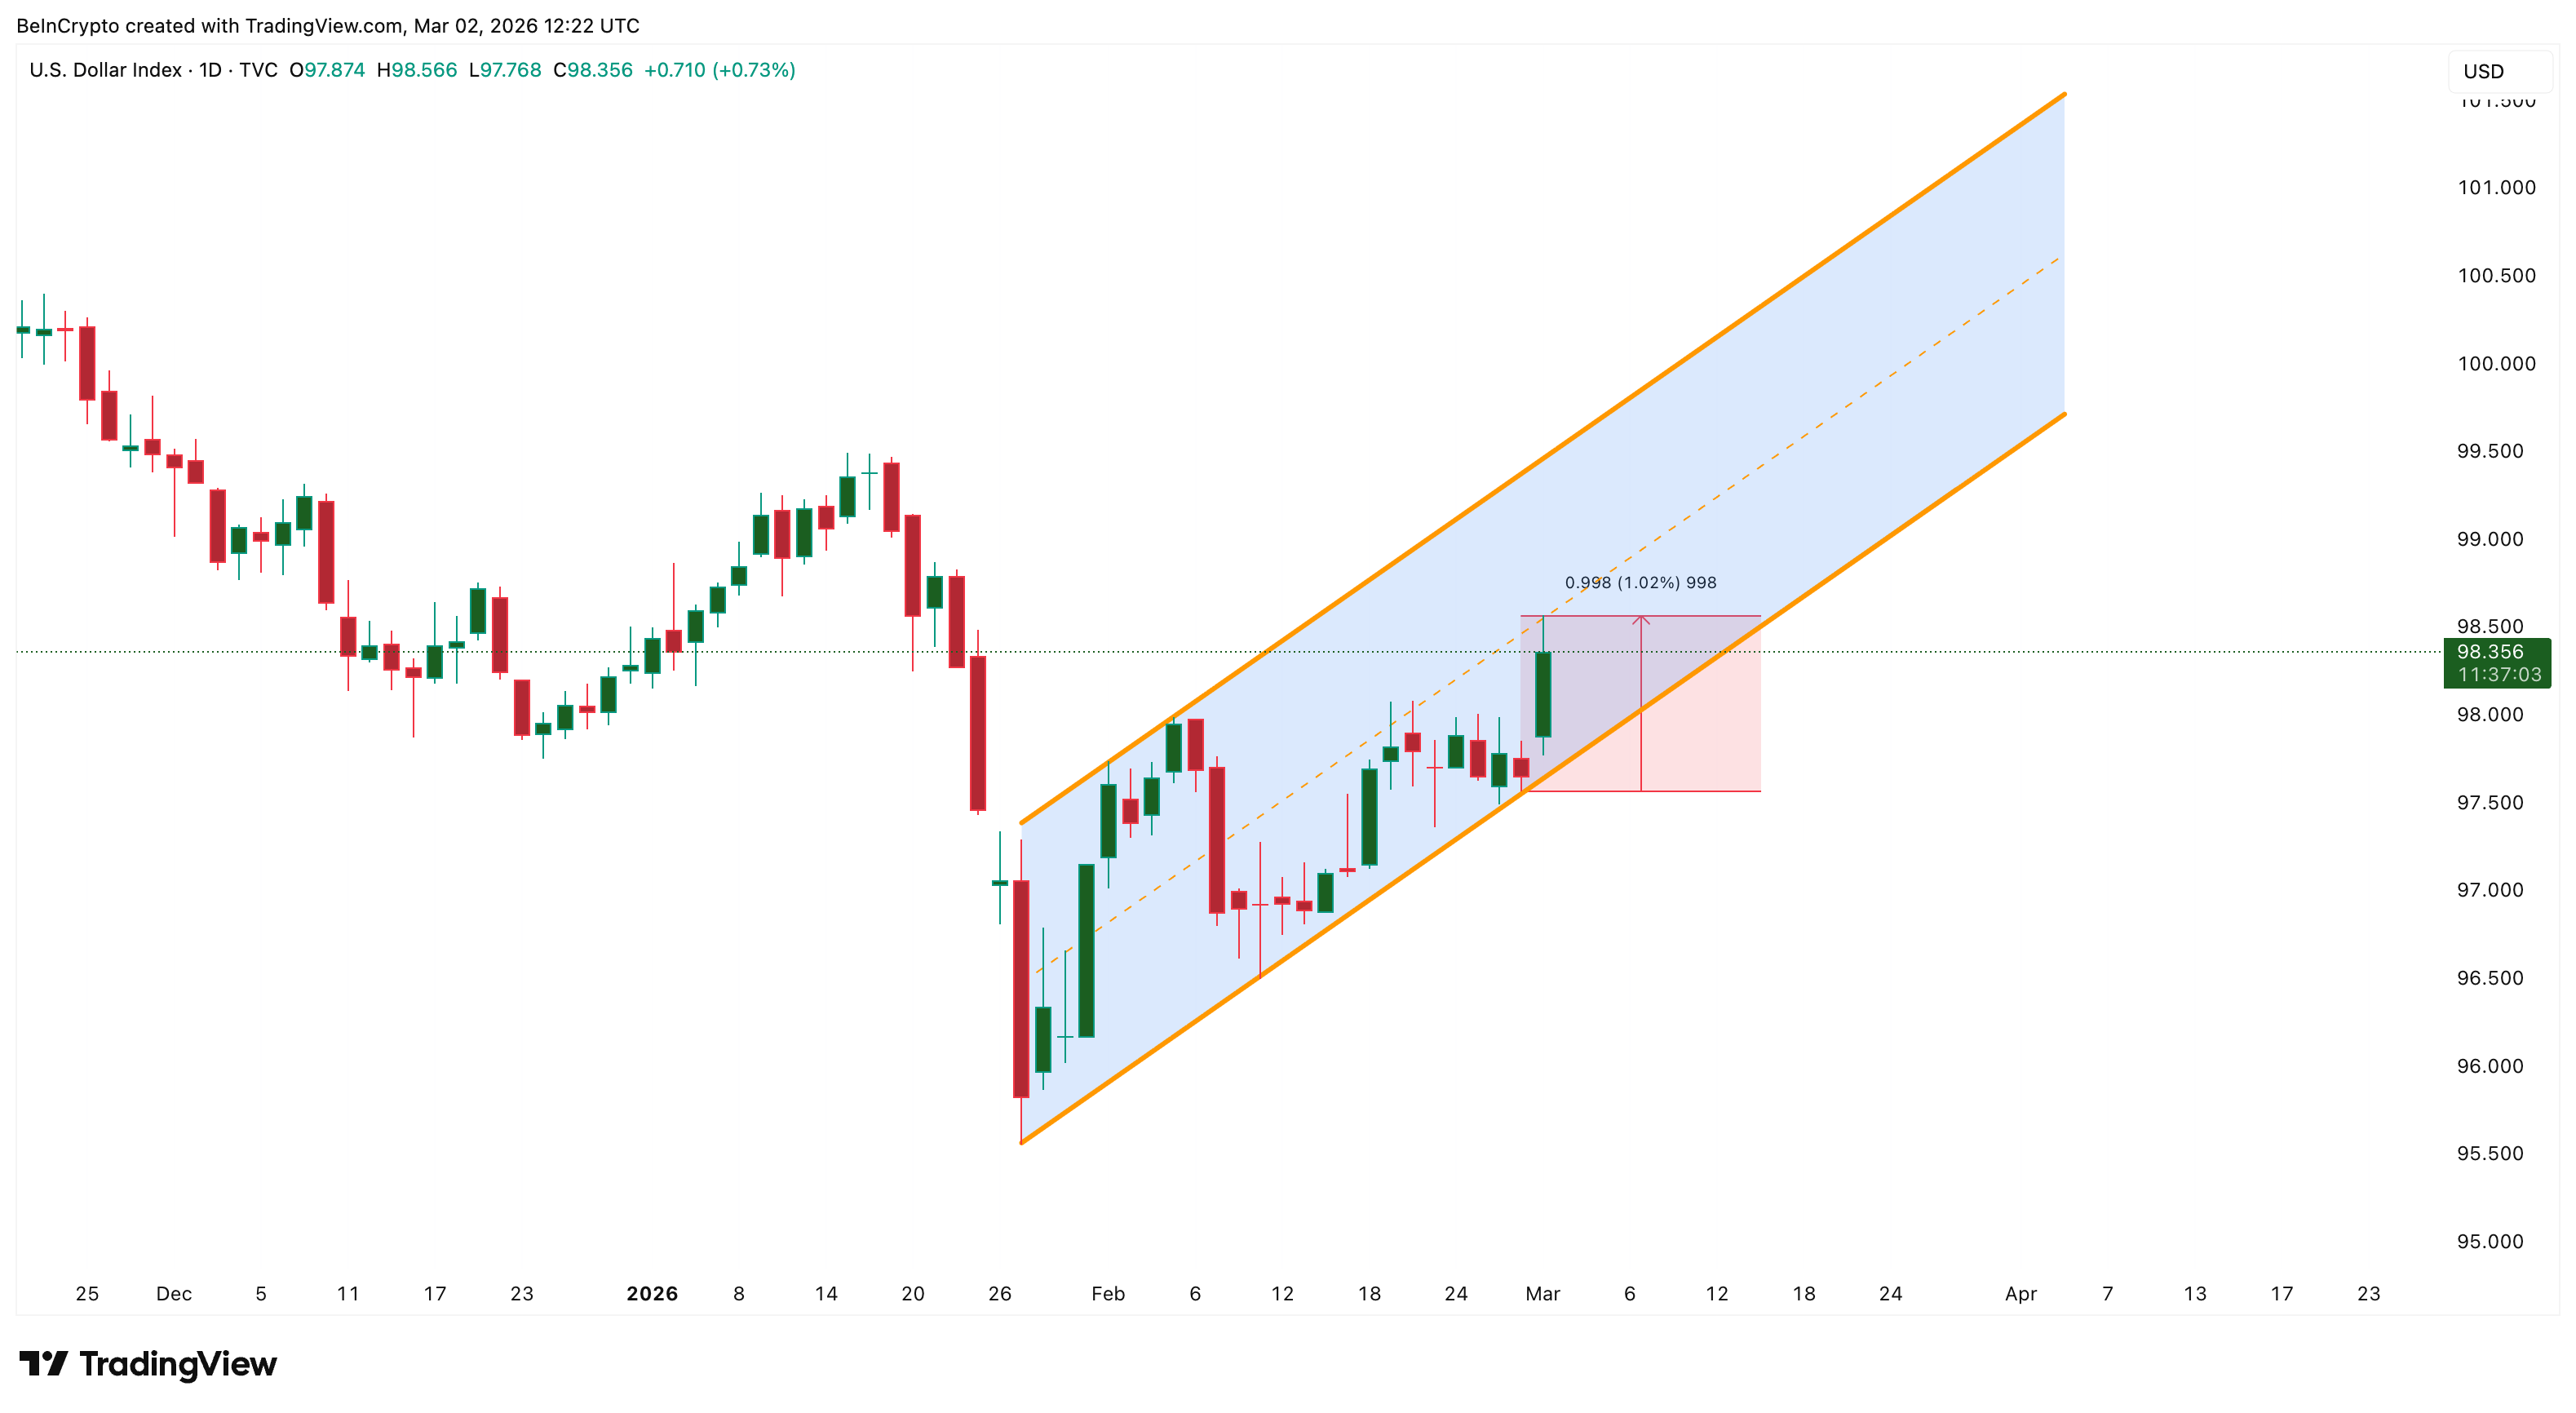
At the same time, the U.S. Dollar Index (DXY), which tracks the dollar’s strength against major currencies, is also rising. Oil is traded around the world in dollars, so a strong dollar makes oil more expensive for foreign buyers. bearish sign.
But another important metric provides a complete picture. Brent Futures (ICEEUR:BRN1!) has seen a sharp increase in open interest, also known as OI. An increase in open interest means new traders are entering the market rather than closing positions. This confirms the short-term bullish bias.
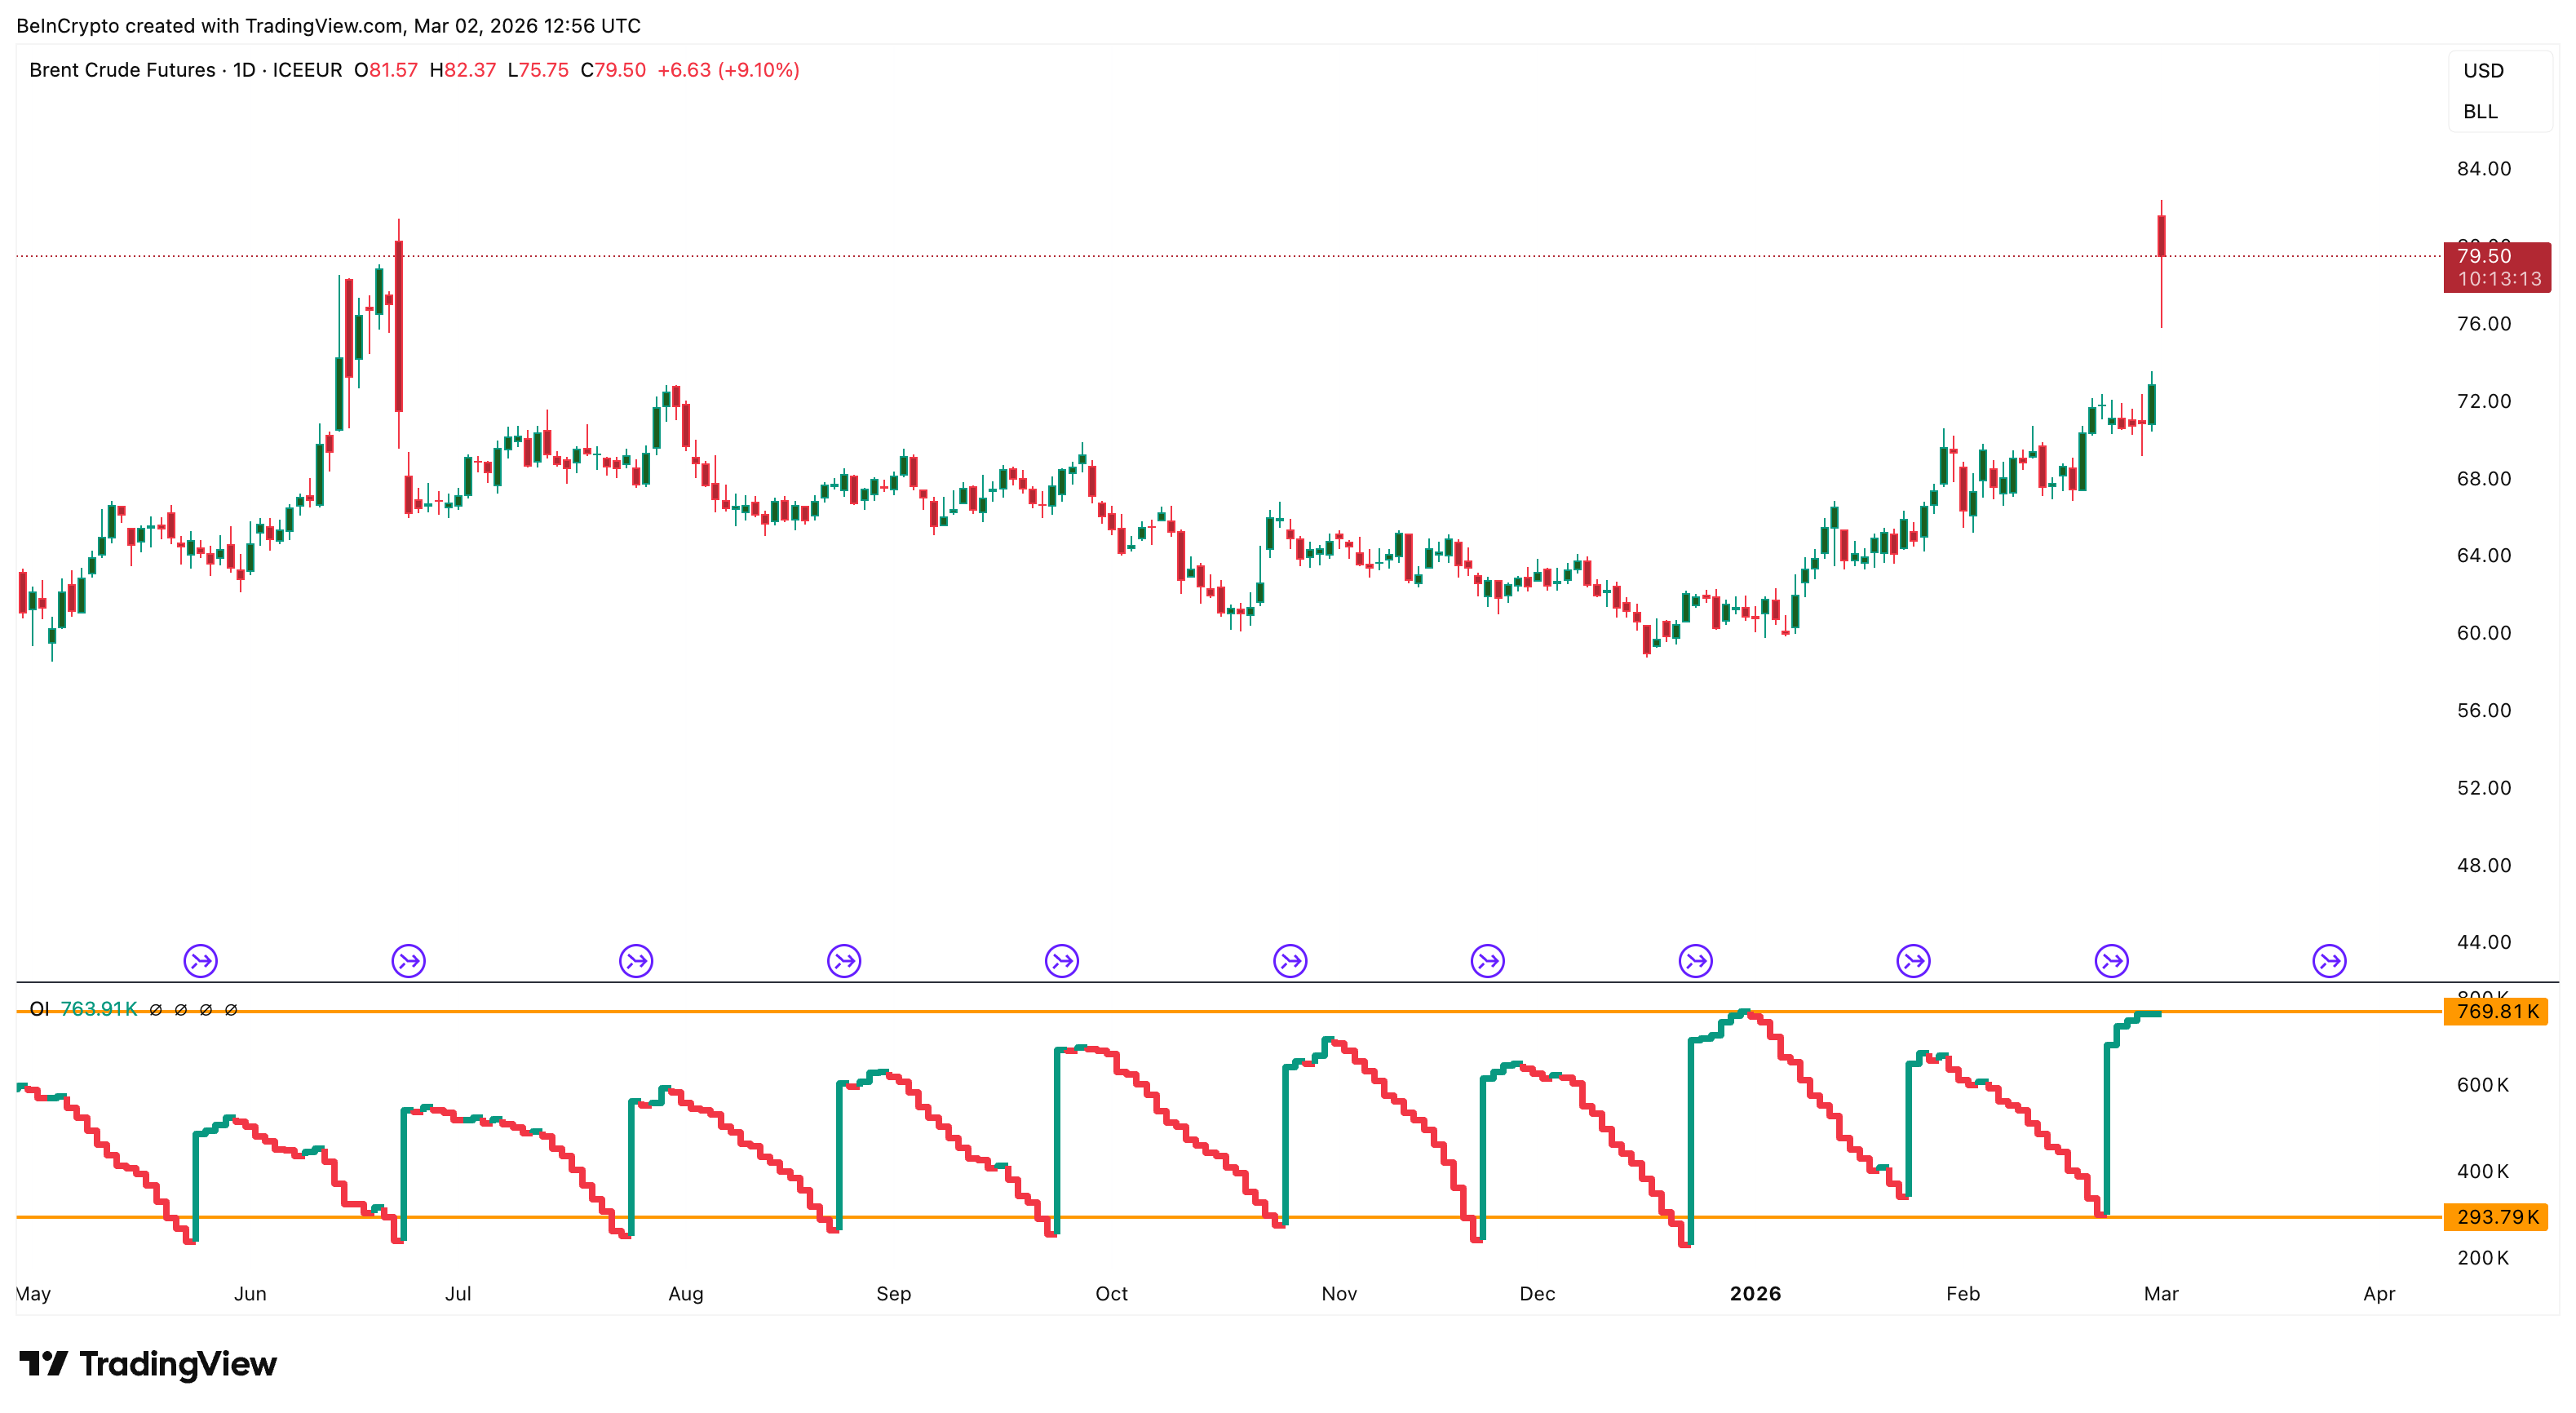
This shows that oil prices are not falling due to lack of interest. Instead, the market continues to absorb the selling and new positions are built. However, traders should be wary of flattening open interest.
A rising price with flat open interest means the movement is likely being driven by short covering rather than new purchases, so the trend may be weak and unsustainable.
War drives up current prices, while OPEC supply increases increase future risks
At the same time, OPEC, the Organization of the Petroleum Exporting Countries, announced a production increase of 206,000 barrels per day starting in April. OPEC is a group of major oil producing countries that control most of the world’s supplies.
Typically, when supply increases, oil prices fall because more oil is available.
But while OPEC’s production increases came later, war risks had an immediate impact on supply, so oil prices continued to rise. This creates a contradiction between short-term supply insecurity and long-term supply growth.
The Strait of Hormuz remains at the center of this risk. Even the possibility of disruption is enough to alarm traders and maintain upward pressure on oil prices. This explains why open interest started to level out and why there was selling pressure after the gap up began. That’s because traders remain cautious about chasing oil price increases while the risk of sudden supply or macro shifts remains high.
Futures positioning shows the market is bracing for larger moves in oil prices
Futures positioning shows that the oil price breakout is attracting strong participation. The sharp rise in open interest in Brent Crude Oil Futures (ICEEUR: BRN1!) that we saw earlier confirms that traders are aggressively opening new positions as volatility increases.
This positioning trend is spreading beyond traditional markets. Platforms like Aster, a crypto-based derivatives exchange, have launched oil perpetual futures.
The rise in oil trading on crypto platforms shows how widespread this positioning has become. This reflects a broad positioning across financial markets.
Key oil price levels are tracked using Brent Crude Oil CFDs and Brent Crude Oil Futures are used to track volume and open interest.
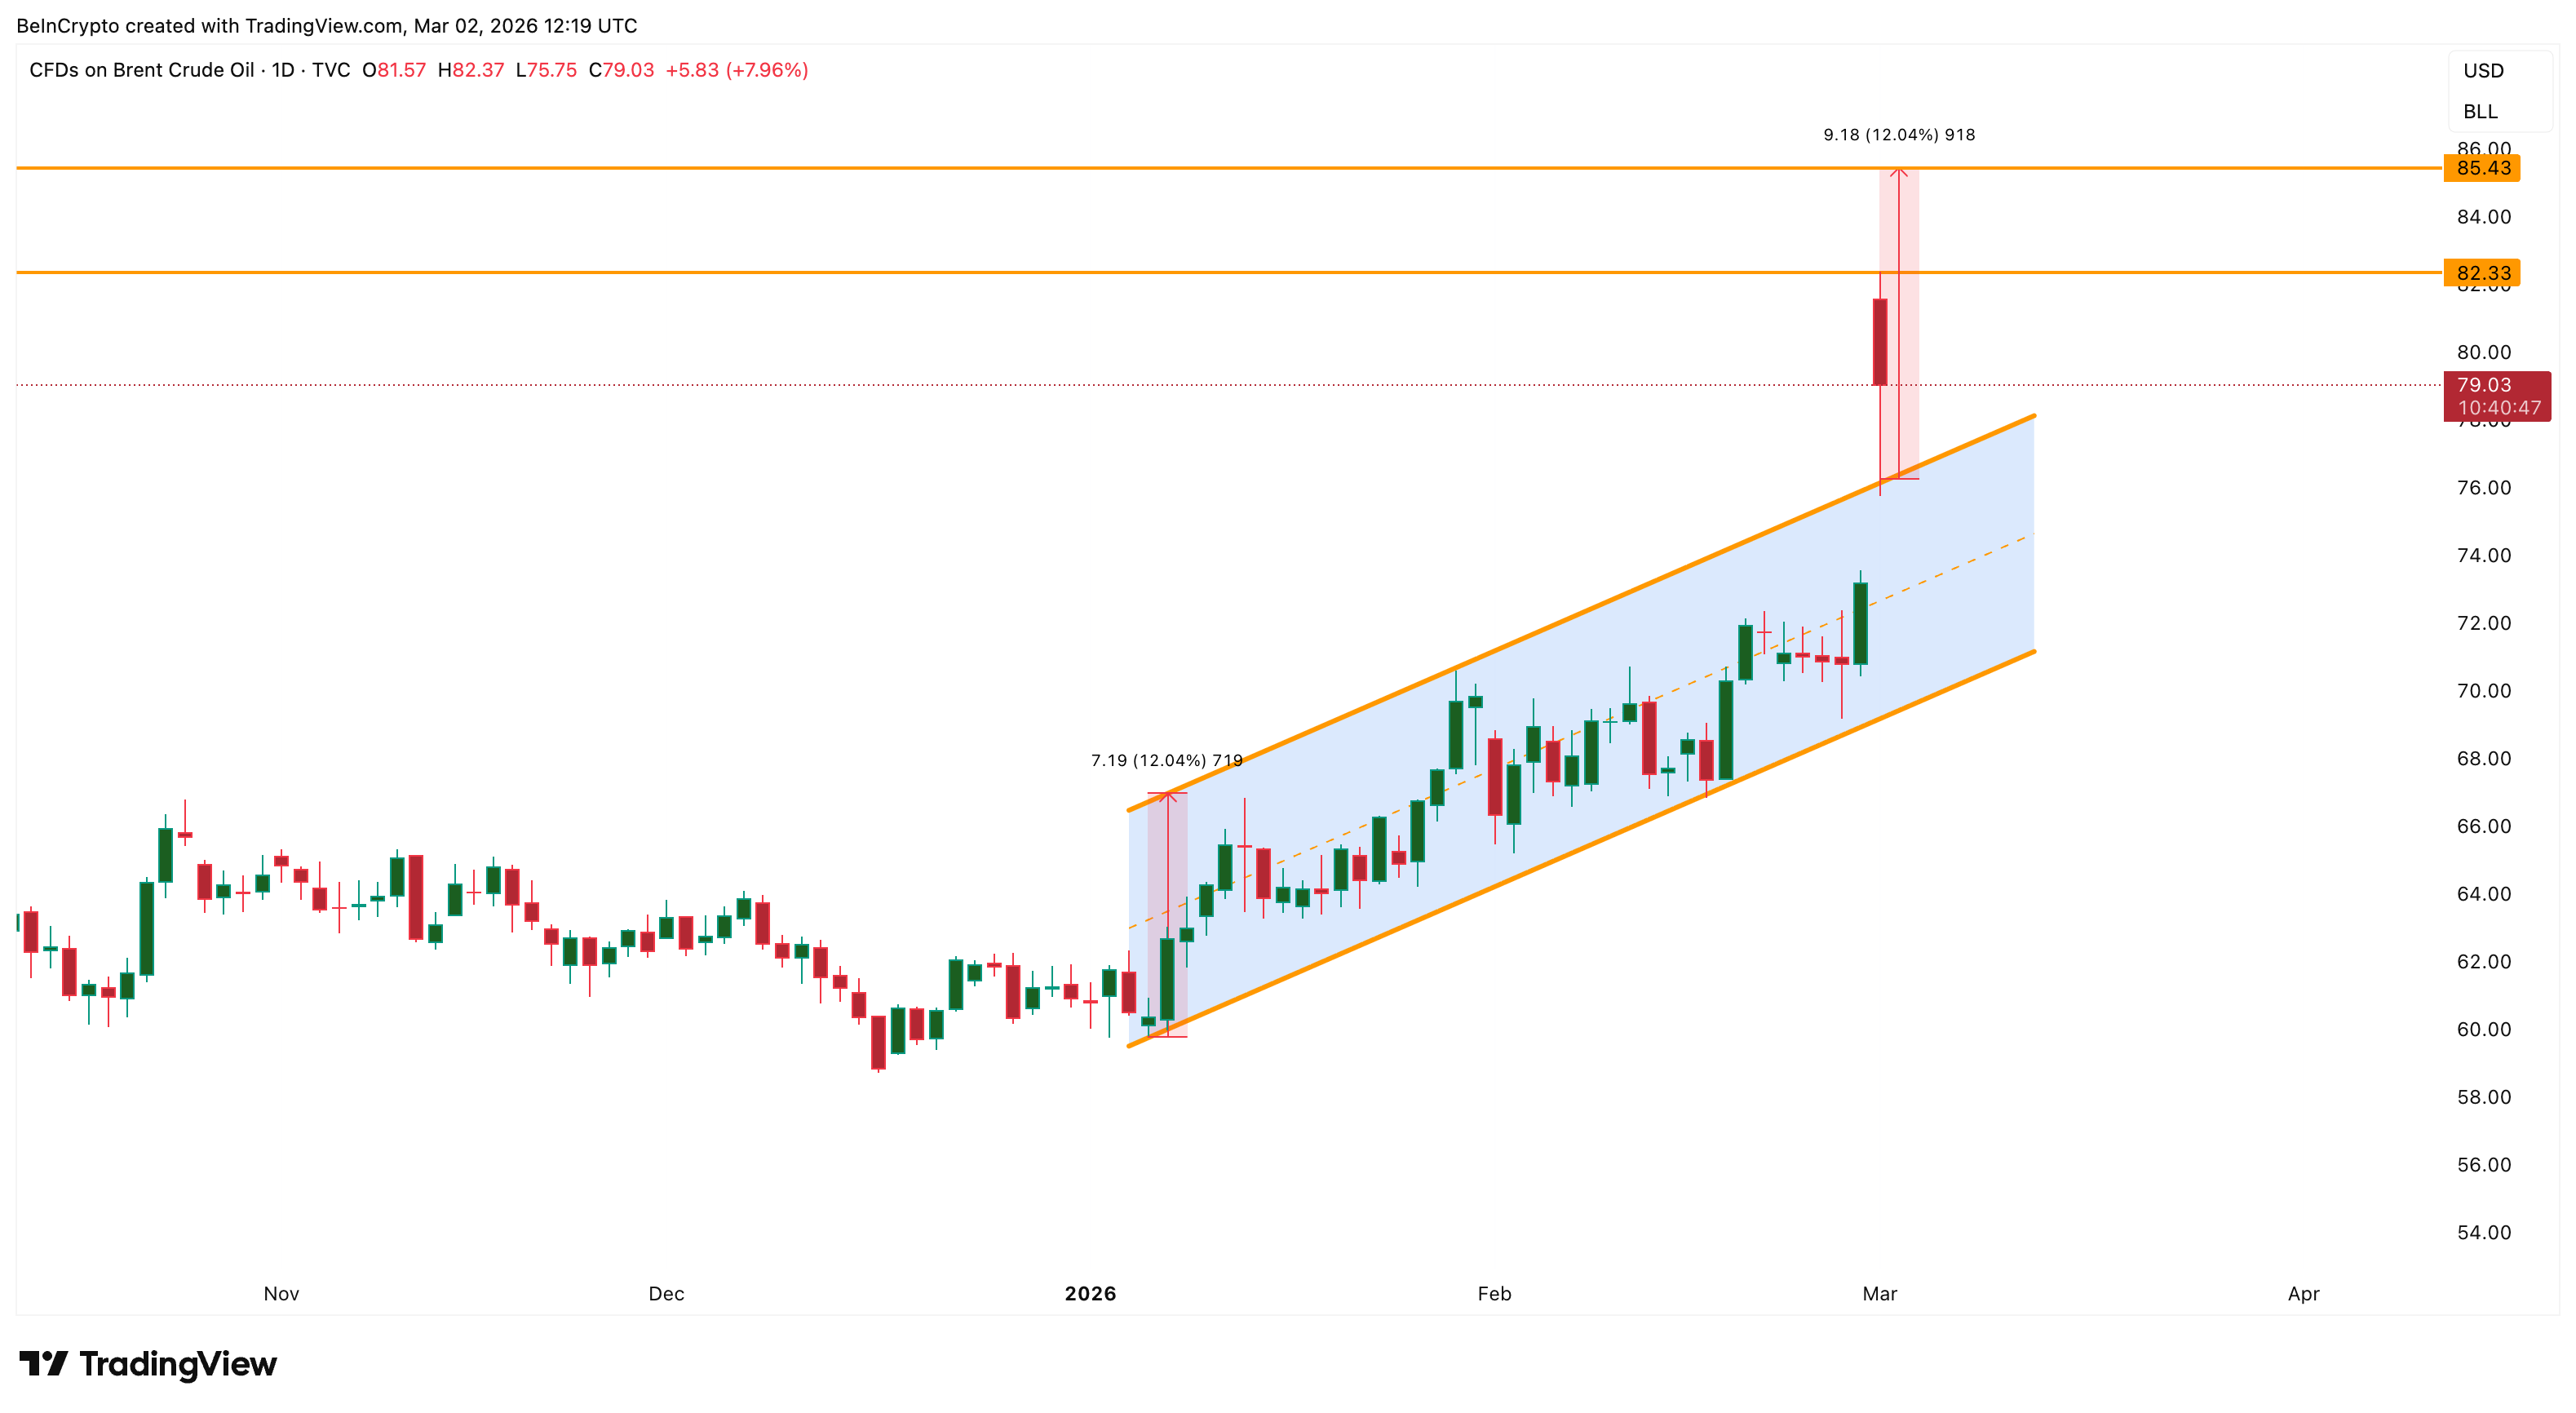
According to the chart, the first resistance level remains at $82, which coincides with the Fibonacci retracement (discussed below).
If oil prices rise above $82, the next target will be $85 based on the upward channel breakout prediction. If geopolitical risks persist, the next resistance levels could be seen at $93 and $104. Adding to this current strength is Exponential Moving Average (EMA) positioning.
It measures the average price over time, with more emphasis on recent data, and we recently saw a golden crossover where the 50-day EMA broke above the 200-day EMA. This is a signal that previously preceded the latest bull market. The 100-day EMA is now rising toward the 200-day EMA, indicating stronger support for the trend.
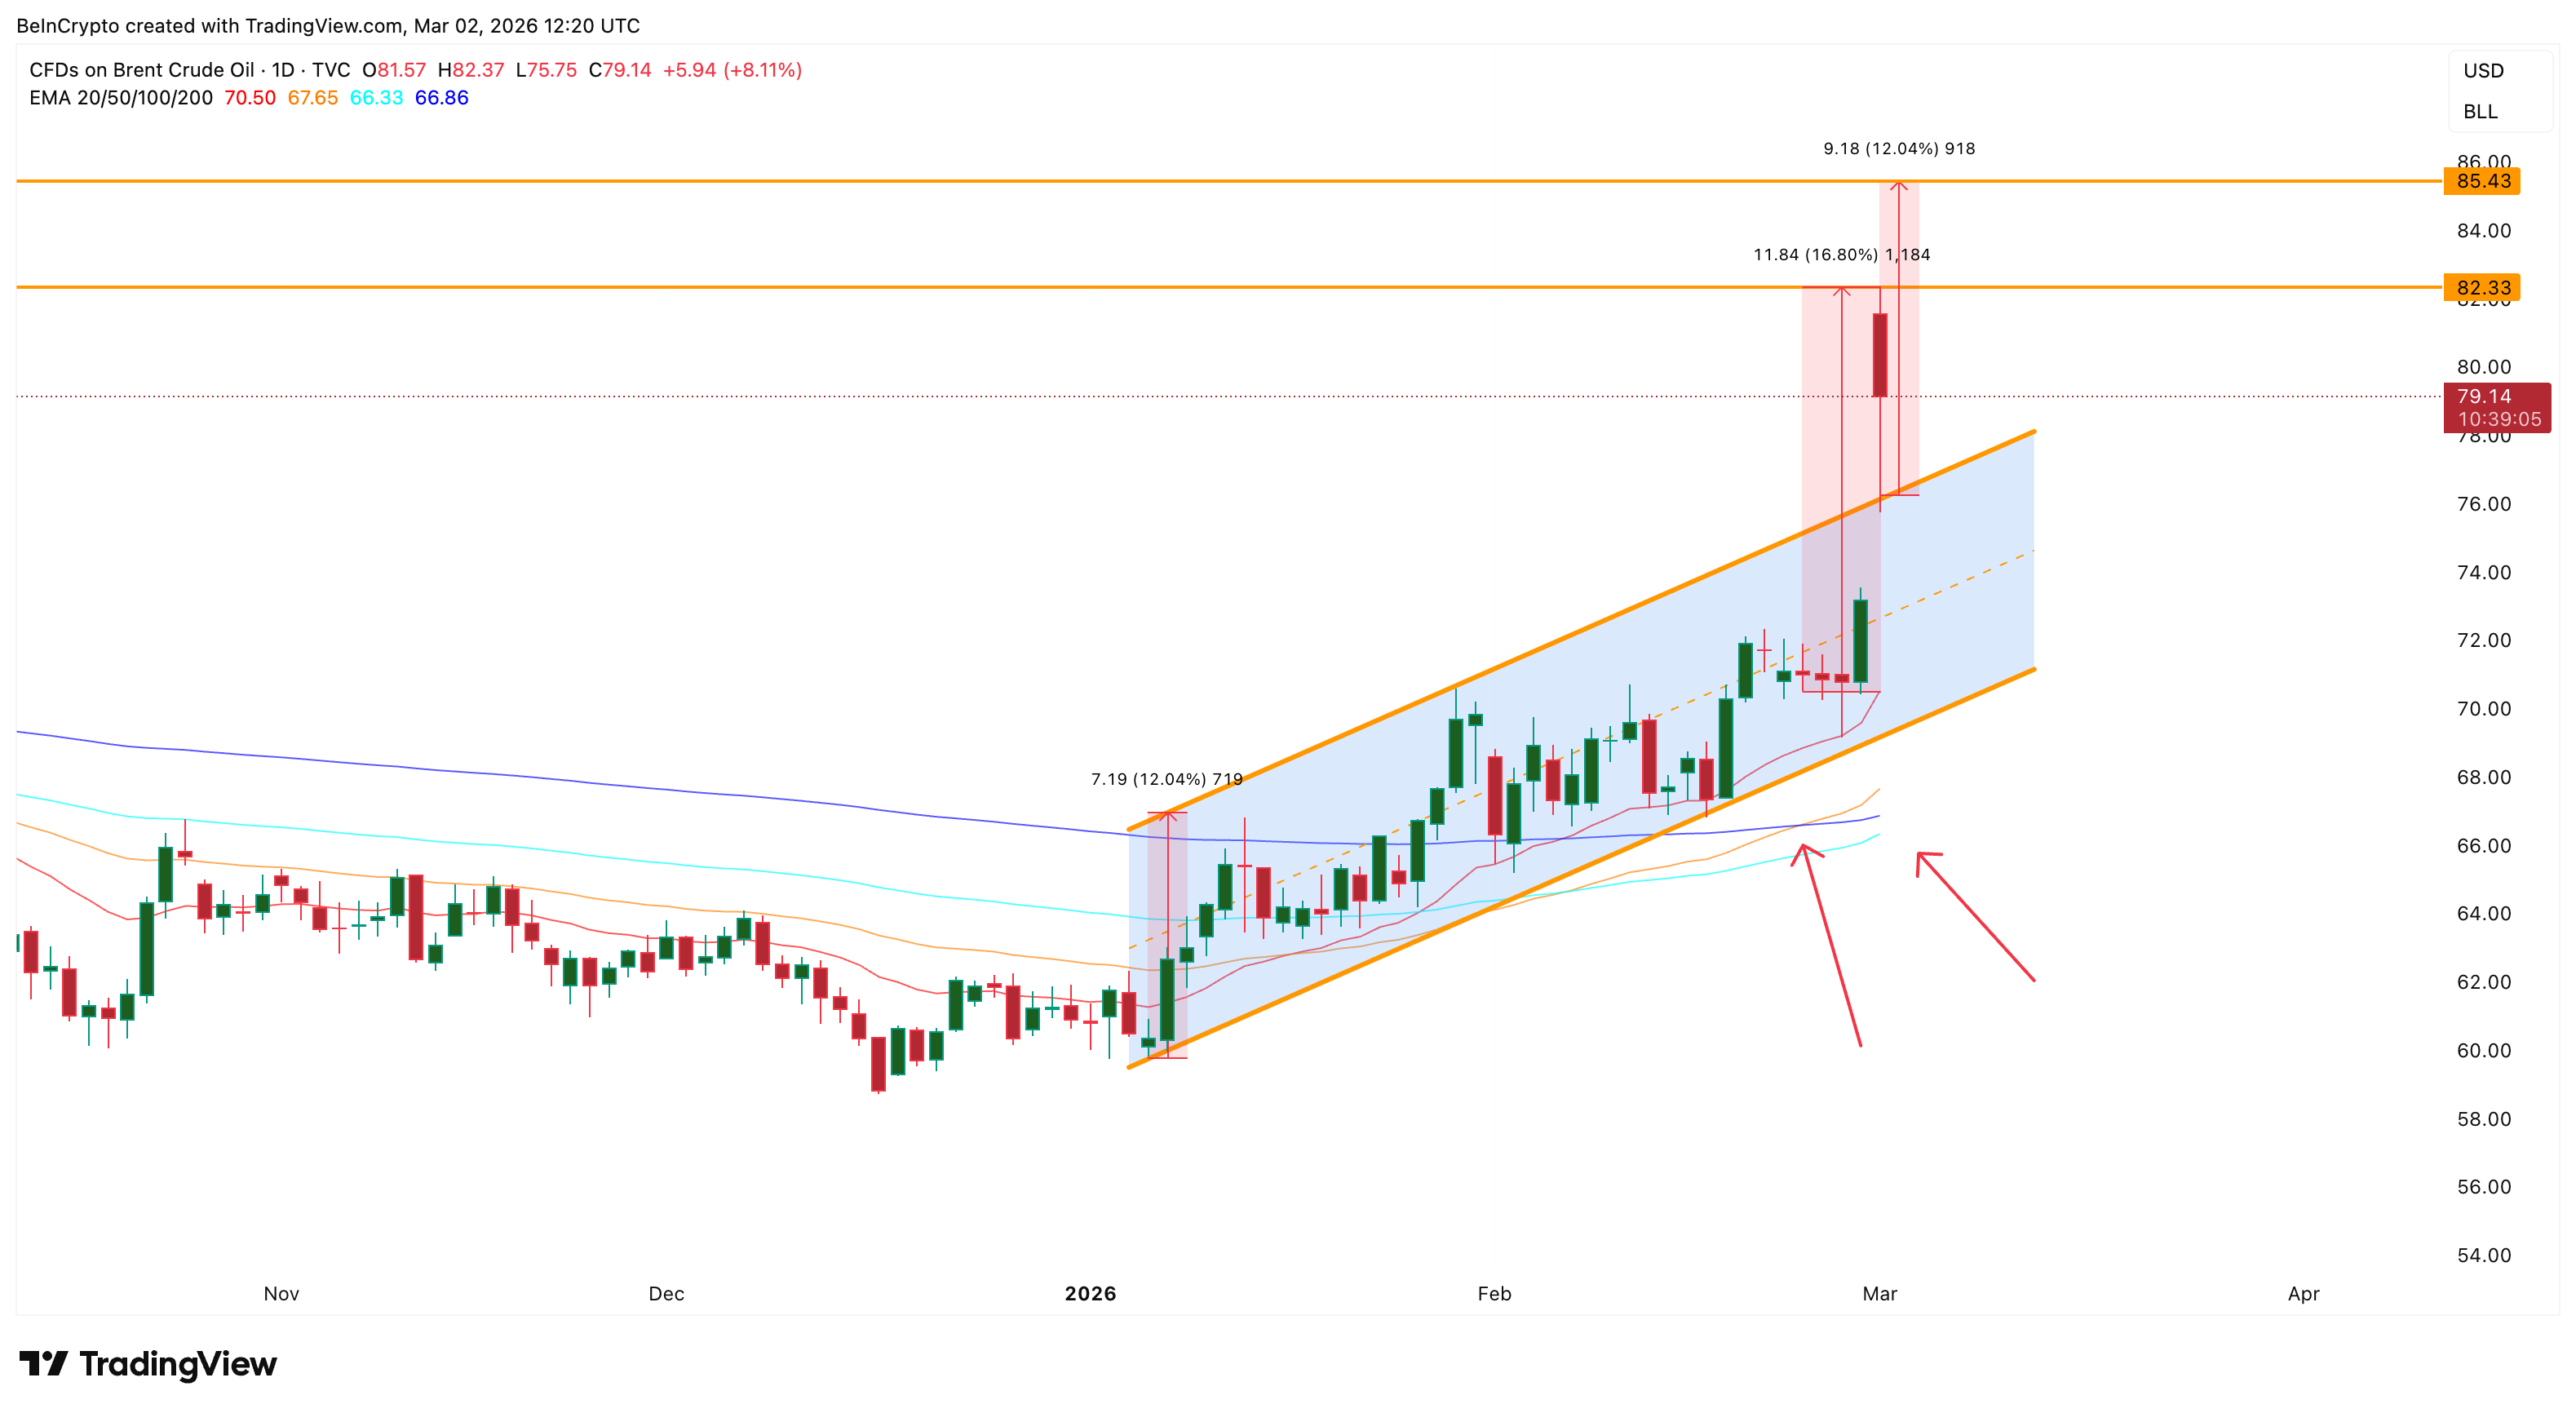
If this bullish crossover is confirmed, an $85 target based on an ascending channel prediction could emerge first.
However, the most important support level is $75.
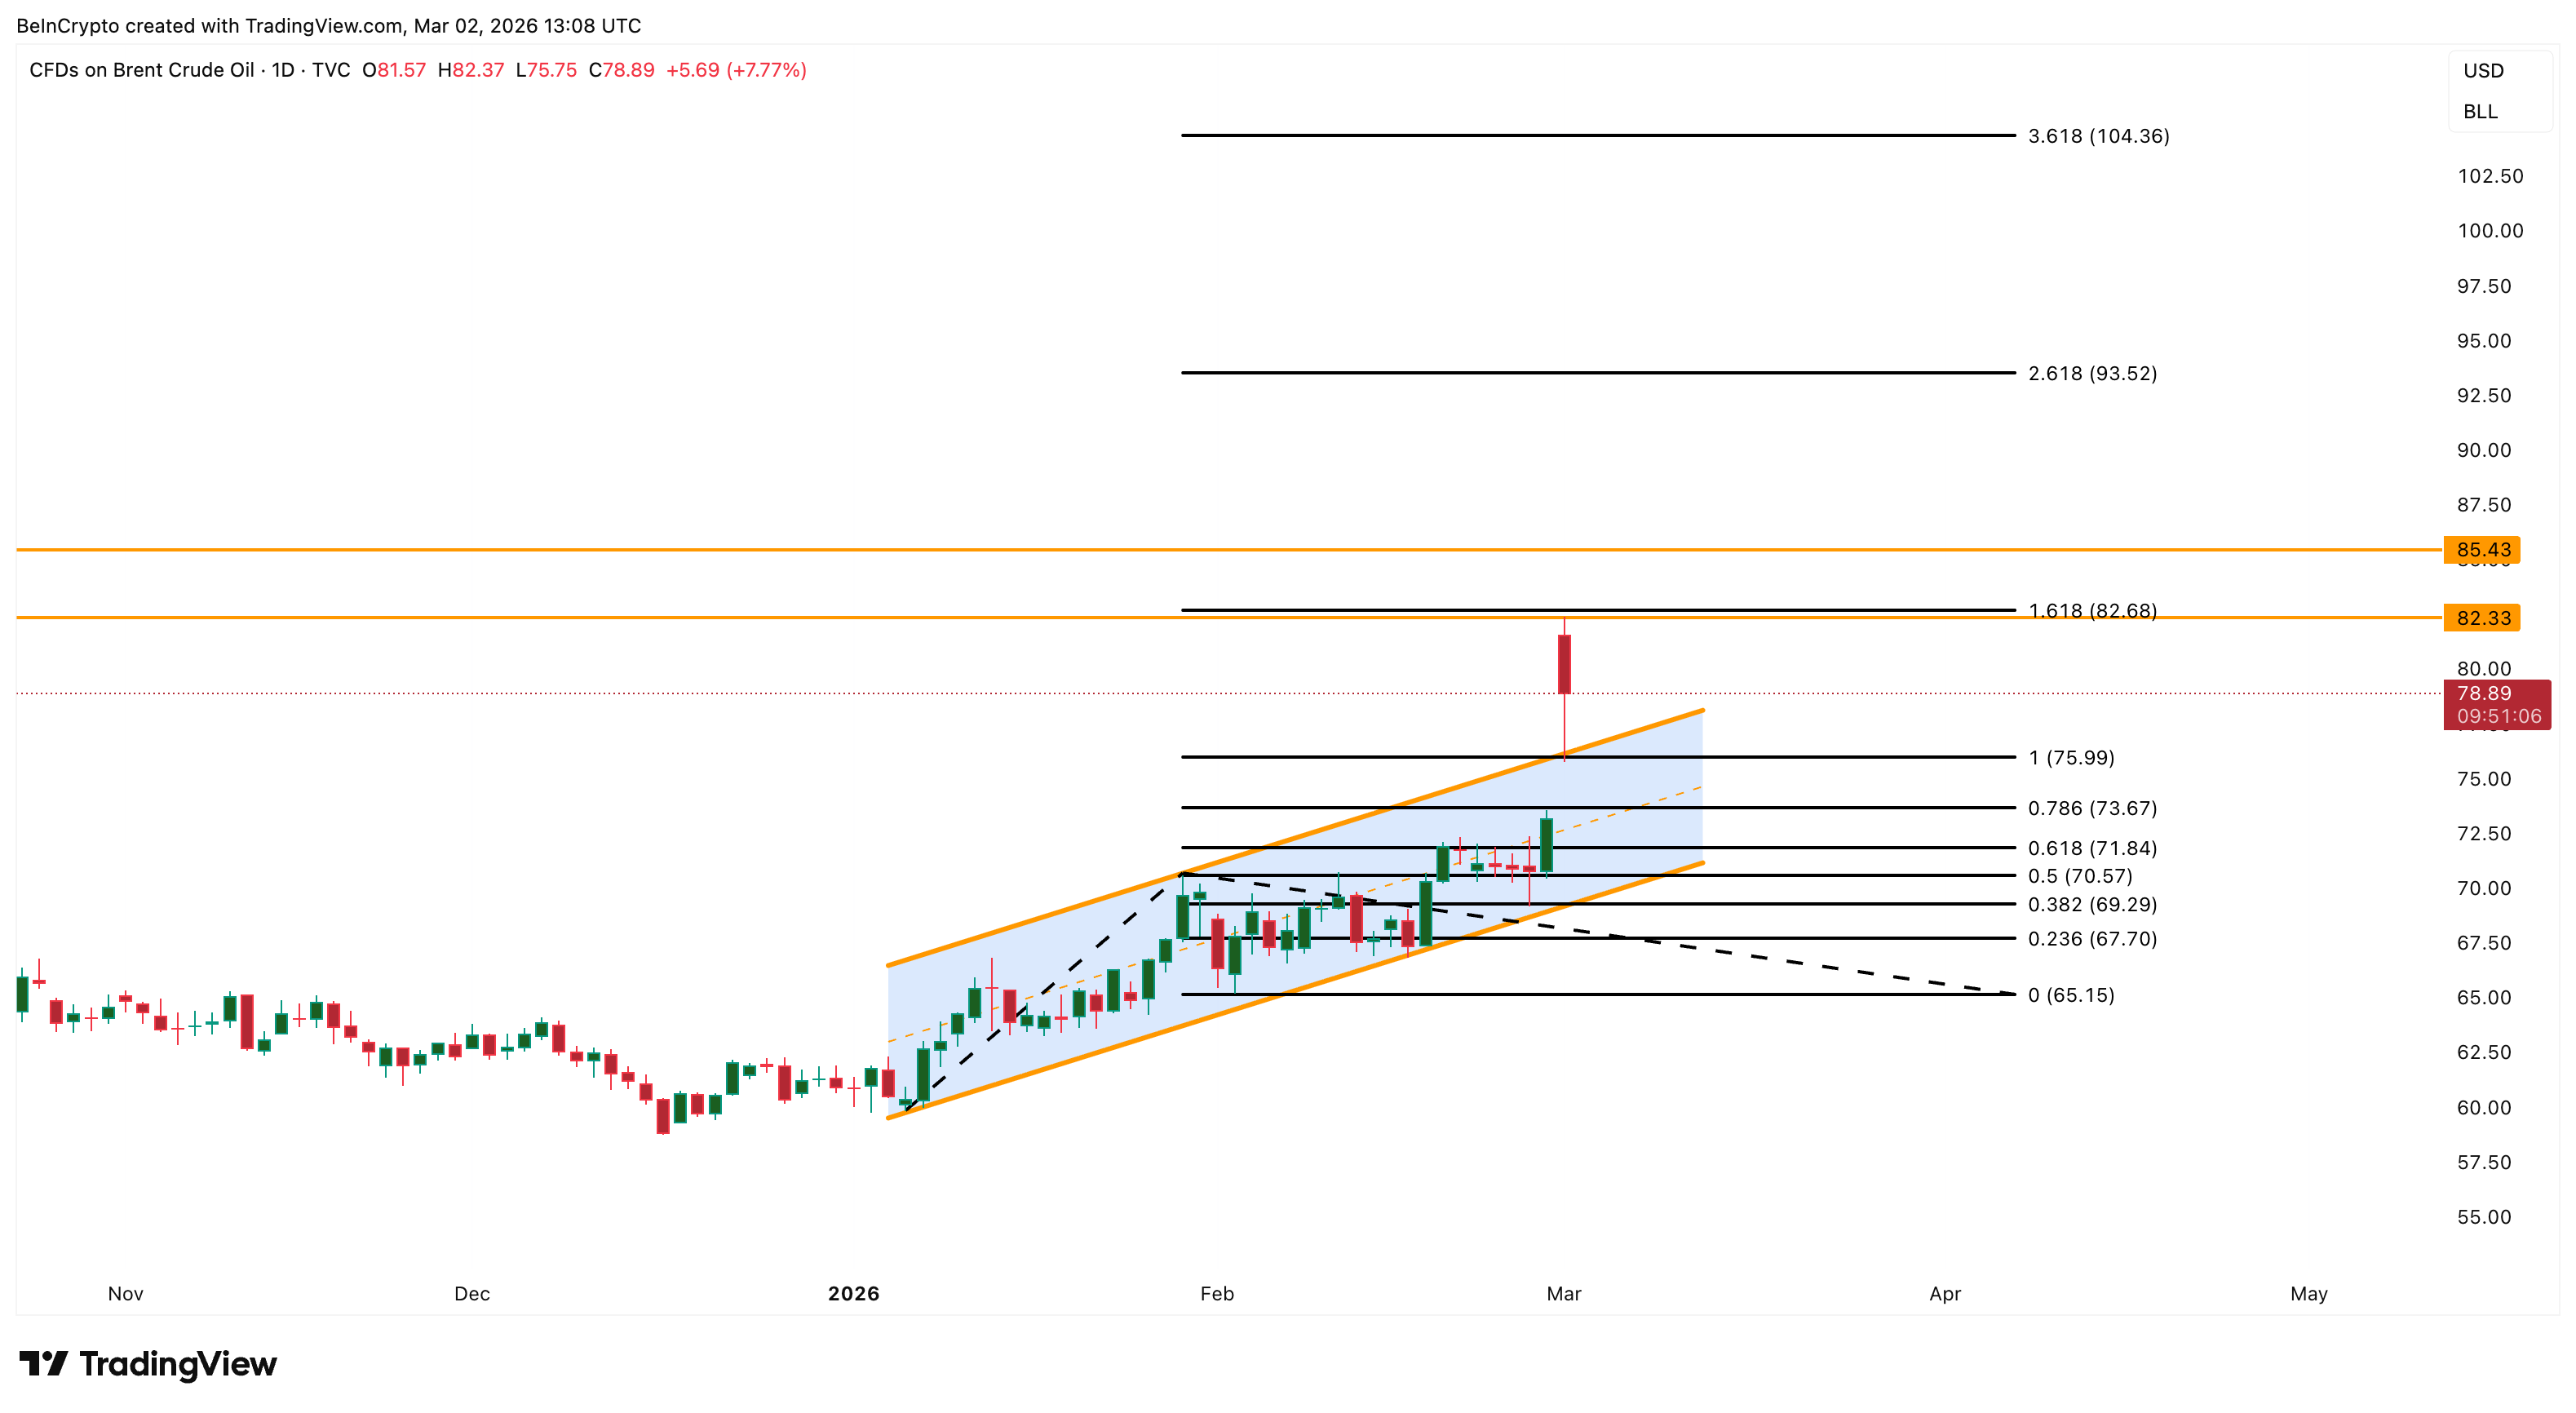
If the oil price falls below $75, it could fall toward $73 or $71. However, the possibility of peace talks and a drop below $67 will only weaken the bullish structure.